Order Flow Pro Suite

Order Flow Indicator for TradingView

Order Flow Indicator on a futures chart showing institutional buyer histogram, absorption, and volume delta trend line

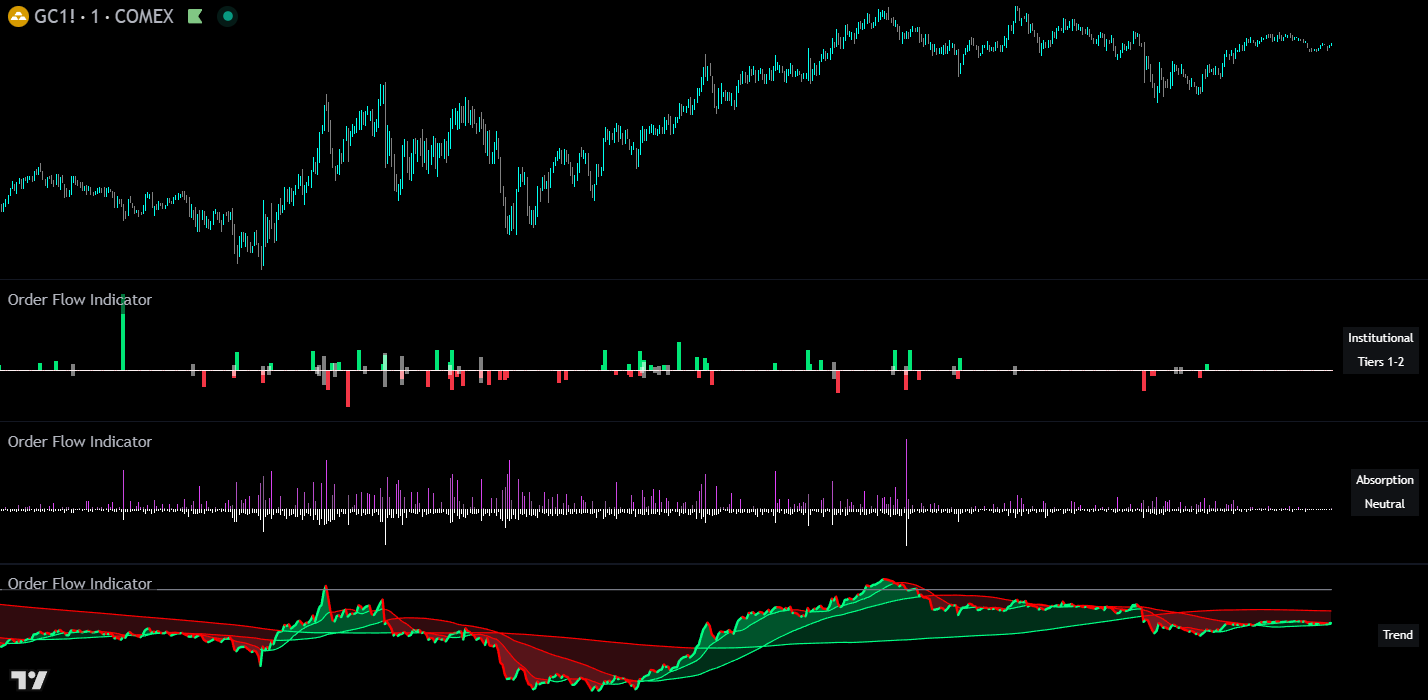
The Order Flow Indicator reveals what’s happening beneath price on TradingView charts. Four tick-data histograms: Institutional Buyer, Buy & Sell Pressure, Absorption, and Neutral Volume combined with a cumulative delta trend line powered by volume footprint data to show directional pressure, absorption, and large order activity for serious day traders and scalpers.

Built by Lane Dotson · Last updated · View on TradingView →
Part of the Order Flow Pro Suite - 4 indicators for $169.99/mo. View all included indicators → See pricing →
Volume Footprint Data: The histogram tools analyze every individual tick within each chart bar( potentially hundreds or thousands of data points) using proprietary scoring formulas to calculate directional pressure, absorption, and large order classification. The Order Flow Trend Line pulls volume delta from TradingView's native footprint data, providing expanded historical depth and TradingView Premium compatibility. The histogram tools analyze tick-level data through proprietary scoring algorithms.

UNDER THE HOOD

Core Features

The Order Flow Indicator combines five distinct tools in a single package: four tick-data histograms and one volume footprint delta trend line. Each tool can be enabled independently and displayed on separate chart panes for clean analysis.

1. Institutional Buyer Histogram

The institutional buyer histogram identifies and displays large orders that likely represent institutional or professional trading activity. The indicator uses a proprietary classification system with an adaptive algorithm to detect which orders are the most important, automatically calibrating to different instruments and market conditions without manual adjustment.

Large orders are classified by direction:

  • Buy Orders (green, above zero): Large orders where price moved up
  • Sell Orders (red, below zero): Large orders where price moved down
  • Neutral Orders (white, split across zero): Large orders with no directional impact

The tiered filtering system allows you to adjust sensitivity:

  • Tier 1 Only: Shows only the absolute largest, most significant orders
  • Tier 1 & 2 Only: Shows very large orders (default setting)
  • Tier 1, 2 & 3 Only: Shows large orders with more frequency
  • All Tiers: Shows all significant orders above normal retail size
  • Use Order Size Filter Only: Bypass the adaptive tier system and filter purely by a specific order size threshold

An optional Size Filter can be enabled to set an absolute minimum order size in addition to tier filtering, allowing for precise control over which orders are displayed.

Institutional buyer histogram from the Order Flow Indicator showing large buy, sell, and neutral orders with tier filtering
The institutional buyer histogram displaying Tier 1 & 2 filtered large orders. Green bars represent institutional buying, red bars represent institutional selling, and white bars represent neutral large orders.

2. Buy & Sell Pressure Histogram

Visualizes the total directional pressure within each bar using a proprietary scoring system that weights volume by price impact. The histogram height represents total pressure intensity, while the color gradient ranging from neutral gray to green (buying) or red (selling) indicates how one-sided the activity was. Bars with strong directional conviction display more saturated colors, while mixed or balanced activity remains closer to neutral.

The color intensity is determined by custom adaptive algorithms that compare current activity against recent historical context, providing visual feedback about the strength and conviction of each bar’s order flow.

Buy and sell pressure histogram from the Order Flow Indicator showing directional pressure intensity with color gradient
The buy & sell pressure histogram: saturated green and red bars indicate strong directional conviction, while gray-tinted bars indicate mixed or balanced activity.

3. Absorption Histogram

Detects when significant volume occurs without proportional price movement. High absorption readings suggest that large orders may be getting filled without moving the market, potentially indicating institutional order flow, strong support/resistance levels, or an active battle between buyers and sellers, any of which can signal a coming reversal or exhaustion of the move.

The indicator uses proprietary efficiency calculations and adaptive normalization to compare current absorption against recent historical context, automatically adjusting to different market conditions and volatility.

Absorption histogram from the Order Flow Indicator showing volume absorbed without proportional price movement
The absorption histogram: tall bright bars indicate high volume being absorbed without moving price, often signaling potential reversals or exhaustion.

4. Neutral Volume Histogram

Displays cumulative volume where price remained unchanged between ticks. Elevated neutral volume may indicate consolidation, indecision, or large orders being executed at a single price level without directional impact. These are typically limit orders where institutional buyers were trying to get their orders filled without moving the markets.

Neutral volume histogram from the Order Flow Indicator showing unchanged-price volume clusters
The neutral volume histogram: elevated readings signal clusters of limit orders being filled at a single price level without directional impact.

5. Order Flow Trend Line & Moving Averages

Tracks cumulative directional order flow over time using TradingView’s native volume footprint data. Unlike the four histogram tools which process lower timeframe tick data, the trend line uses footprint data which categorizes volume based on intrabar price movement. This provides significantly more historical depth than tick data. Weeks on minute charts, years on daily charts.

The trend line resets at user-defined intervals (hourly, daily, weekly, etc.), with an additional “None” option that builds continuously without ever resetting to zero for longer-term analysis.

Three time-based moving averages (default: 15min, 1H, 4H) provide trend context. Unlike traditional bar-based MAs, these automatically calculate the appropriate length based on your chart timeframe. Optional color-filled areas show when the trend line is above or below each MA for quick visual reference.

Because the trend line uses TradingView’s built-in volume footprint data, it provides significantly more historical depth than the histogram tools. Minute charts pull weeks of data and daily charts pull years of data.

Order flow trend line and moving averages from the Order Flow Indicator showing cumulative volume delta with time-based MAs
The order flow trend line with three time-based moving averages. Tracks cumulative volume delta using volume footprint data.

READING THE DATA

Interpreting the Signals

Institutional Histogram

Institutional buyer histogram interpretation showing buy, sell, and neutral order spikes
Institutional histogram readings: green above zero is buying, red below zero is selling, white is neutral.

Pressure Histogram

Buy and sell pressure histogram interpretation showing color gradient intensity
Pressure histogram readings: saturated colors indicate conviction, gray tones indicate balanced activity.

Absorption Histogram

Absorption histogram interpretation showing high and low absorption readings
Absorption readings: tall bright bars mean volume is being absorbed without moving price.

Neutral Volume Histogram

Neutral volume histogram interpretation showing limit order cluster detection
Neutral volume readings: large values signal institutional limit order clusters at a single price.

Trend Line & Moving Averages

Order flow trend line interpretation showing cumulative delta direction and MA crossovers
Trend line readings: rising green line means cumulative buying pressure is increasing, MA crossovers signal momentum shifts.

HOW TO TRADE WITH IT

Trading Applications

Scalping & Intraday Trading

Use the Institutional Histogram to identify when large players are entering the market. Imbalances between institutional buying and selling often precede short-term price movements. Watch for a strong directional bias from large orders and then look for pullbacks to enter positions in the same direction of the large order bias.

Watch for high spikes in absorption after an extended move up or down. This typically represents a reversal is coming or that the move is exhausted and a pullback to fair price areas is likely so trail your stop tightly if you are already in a position or use the absorption spike as a signal to watch for a potential entry near that spike candle.

Support & Resistance Confirmation

High absorption readings at key price levels may confirm that orders are being absorbed, strengthening the case for support or resistance. Clusters of absorption can help identify accumulation and distribution zones. These often have price reactions that can be scalped for quick profits by trading back towards where price approached the support/resistance level from.

Use the Order Block Indicator for support and resistance levels, and then look for high absorption when price touches those levels indicating large buyers stepping in to protect their positions, which can be excellent bounces for scalp trades.

Trend Confirmation

The Order Flow Trend Line can confirm or diverge from price trends. Strong price moves accompanied by aligned order flow give you more confidence. Divergences between price and cumulative delta may signal weak conviction from traders and indicate a potential reversal is coming.

Institutional Order Detection

Filter for only the largest orders (Tier 1) to see when potential institutional players are most active. These rare, significant orders often precede meaningful price moves. When you see a clear bias in direction from the institutional traders, look for pullbacks and then enter a position in the same direction as the large trader bias.

Volume Analysis

Compare Pressure and Neutral Volume histograms together. High pressure with low neutral volume suggests conviction moves, while high neutral volume with low pressure may indicate consolidation or absorption.

CONFIGURATION

Settings Overview

The settings panel is organized with the Order Flow Trend settings first, followed by the histogram data settings and individual histogram controls. The trend line uses its own native footprint volume data and is not affected by the Data Source or Lower Timeframe settings, which only apply to the four histogram tools.

Real-Time Value Settings

Setting Default Description
Only Show Data For Confirmed Bars Off When enabled, only displays data after bars close to prevent values from updating on open bars

Order Flow Trend Settings

Setting Default Description
Smoothing Length 1 Apply SMA smoothing to the trend line (1 = no smoothing)
Reset Period 1D When cumulative values reset. Options: 5min through 1 Year, or None for continuous accumulation
MA 1 Timeframe 15min First time-based moving average period (can be independently enabled/disabled)
MA 2 Timeframe 1H Second time-based moving average period
MA 3 Timeframe 4H Third time-based moving average period
MA Fill On Optional color fill between trend line and MAs for quick visual reference

Data Settings (Histograms Only)

Setting Default Description
Data Source (empty) Analyze order flow from a different symbol (e.g., ES1! while viewing SPY). Leave empty to use the current chart symbol
Lower Timeframe 1T The granularity of tick data analysis for the four histogram tools. Lower values provide more accuracy but have limited historical depth

Institutional Buyer Histogram Settings

Setting Default Description
Order Size Tier Filter Tier 1 & 2 Only Adjust sensitivity from Tier 1 (largest orders only) through All Tiers (broader detection), or use Size Filter Only mode
Only Show Orders Above Filter Threshold Off Enable an additional absolute minimum order size filter
Order Size Filter Threshold 15 Set a specific minimum volume when the size filter is enabled
Color Settings Green / Red / White Customize buy, sell, and neutral order colors

Buy & Sell Pressure Histogram Settings

  • Enable/disable and invert the histogram
  • Customize buy pressure, sell pressure, and base colors for the gradient system

Absorption Histogram Settings

  • Enable/disable and invert the histogram
  • Customize absorption and base colors

Neutral Volume Histogram Settings

  • Enable/disable and invert the histogram
  • Customize the neutral volume color

Identification Table

  • Enable/disable the on-chart table showing active features
  • Customize position, background color, and text color

GOOD TO KNOW

Important Notes & Limitations

Order Flow Trend Line requires a TradingView Premium subscription (or higher). The trend line uses native TradingView footprint data and provides significantly more historical depth than the histogram tools.
Histogram tools require tick-level data for maximum accuracy. Tick-based intervals (1T) require a TradingView Ultimate subscription. Second-based intervals require Premium or Ultimate but provide less granular analysis since multiple transactions can happen within a single second bar.
Historical tick data is very limited. Even on the Ultimate plan, only ~40,000 bars of historical tick data is available, which can be days of data on some charts and only hours on high-activity instruments like NQ.
Volume data is required. Instruments without volume data (such as some forex pairs from certain brokers) cannot be analyzed with this tool.
Without "Only Show Data For Confirmed Bars" enabled, the current bar's values will update in real-time as new ticks arrive. Enable this setting if you prefer to act only on finalized data.
While designed primarily for futures trading analysis, this indicator works on any instrument with volume data including stocks, forex, ETFs, and cryptocurrencies.

POWER USER TIPS

Tips & Best Practices

GET ACCESS

Get the Order Flow Indicator
Plus 3 More Order Flow Tools

Access the full Order Flow Pro Suite on your TradingView charts – all 4 indicators with volume footprint data and priority support.

$169.99/month · Cancel anytime · Try it: $99.99 for 2 weeks
All Future Updates
Volume Footprint Data
Chart Templates
Video Walkthroughs
Priority Support

COMMON QUESTIONS

Frequently Asked Questions

The Order Flow Trend Line requires a TradingView Premium subscription or higher. The four histogram tools (Institutional Buyer, Buy & Sell Pressure, Absorption, and Neutral Volume) work best with tick-level data which requires a TradingView Ultimate subscription. You can use the histograms with second-based intervals on a Premium plan, but the accuracy will be reduced since multiple transactions can occur within a single second bar.
The Order Flow Indicator works on any instrument that has volume data, including stocks, futures, ETFs, forex, and cryptocurrencies. Some forex pairs from certain brokers do not report volume data. The indicator cannot analyze instruments without volume data. For the most accurate results, futures contracts are recommended because they have the deepest and most reliable volume reporting.
The Order Flow Indicator provides five standalone analysis tools displayed as separate histogram and trend line panes below your chart. Order Flow Candles scores each individual candlestick on your main chart with a directional grade based on its internal order flow composition. The two indicators complement each other. The Order Flow Indicator shows broader market dynamics while Order Flow Candles gives you a per-bar score directly on your price chart.
Gaps in histogram data typically occur because TradingView had an issue parsing tick data, or because no tick data was available from the exchange during that time period. Refreshing your browser usually resolves parsing issues. If gaps persist, try toggling the "Fix Indicator Loading Error" checkbox in settings to force a restart. The Order Flow Trend Line is less susceptible to gaps because it uses a different data source with more historical depth.
Yes. The histogram tools process the same underlying tick data regardless of your chart timeframe. The analysis is always based on the lower timeframe data you configure. You can open multiple chart tabs at different timeframes and add the indicator to each one. The Order Flow Trend Line's time-based moving averages automatically adjust their length calculations to match your chart timeframe, so they represent the same time period whether you're on a 1-minute or 15-minute chart.
Most cumulative volume delta indicators estimate buying and selling direction based on price movement between bars. If price moved up, the volume is classified as buying. The Order Flow Trend Line uses Tradingview's native volume footprint data where every unit of volume is classified as a buy or a sell by the direction price moves on that tick. The trend line also includes time-based moving averages that automatically adjust to your chart timeframe and a configurable reset period for controlling cumulative accumulation.

CHANGELOG

Release Notes

Performance Optimization

Updated the footprint data call parameters to improve performance on tickers with large amounts of ticks per bar.

What Changed
Optimized footprint data call parameters for high-activity instruments
Volume Footprint Delta & Trend Line Overhaul

This update completely overhauled the Order Flow Trend Line with a new, far more accurate data source and reorganized the settings panel for a cleaner experience. All histogram tools remain unchanged.

What Changed
The Order Flow Trend Line now pulls volume delta directly from TradingView's native footprint data.
The old "Calculation Method" dropdown (Basic/Advanced) has been removed. There is now one data source and it is the most accurate available
Significantly more historical data: minute charts pull weeks of data, daily charts pull years
TradingView Premium subscription is now sufficient for the trend line (previously required Ultimate)
New "None" option for Reset Period. Cumulative delta builds continuously without resetting
Trend line is now enabled by default; institutional buyer histogram is now disabled by default
Settings panel reorganized: trend line settings appear first, histogram data settings are clearly separated
What Stayed the Same
All four histogram tools (Buy & Sell Pressure, Absorption, Neutral Volume, and Institutional Buyer) remain completely unchanged in calculation logic, data pipeline, and plotting
Identification table, MA calculations, fill logic, and all color settings unchanged

EXPLORE THE SUITE

Related Indicators

Order Flow Pro

Scores each candlestick directly on your price chart with a directional grade based on its internal order flow composition. Pairs naturally with the Order Flow Indicator’s histogram analysis.

Order Flow Pro

Detects and visualizes institutional buying and selling activity with a different methodology. Use it alongside the Order Flow Indicator’s institutional buyer histogram for cross-confirmation.

Order Flow Pro

Identifies supply and demand zones where institutional orders were previously executed. Combine with the Order Flow Indicator’s absorption histogram to confirm when price returns to these levels.