Performance Optimization
Updated the footprint data call parameters to improve performance on tickers with large amounts of ticks per bar.
What Changed
• Optimized footprint data call parameters for high-activity instruments
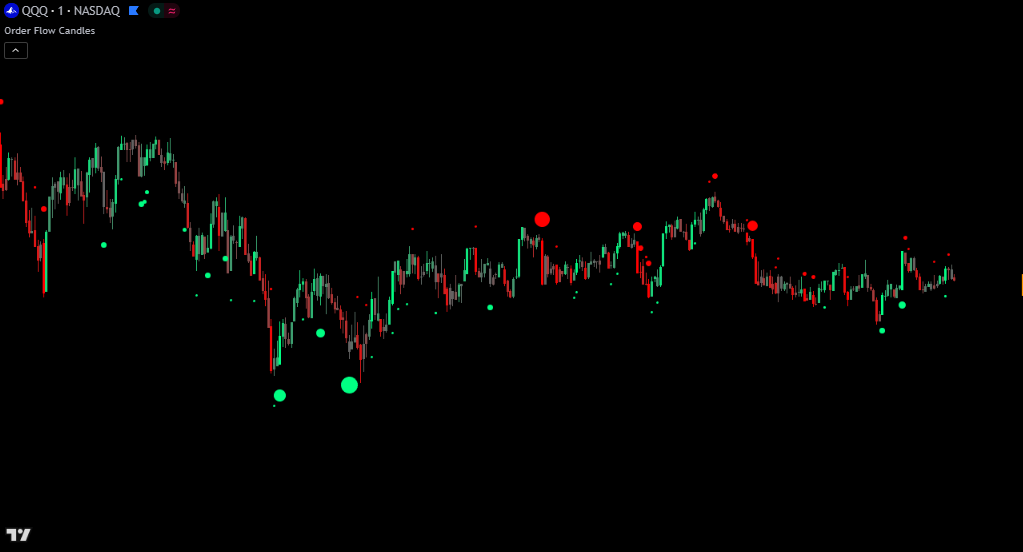
Order Flow Candles is a TradingView indicator that colors each candlestick with a 10-tier gradient reflecting the intensity of buying or selling pressure on every bar. It combines price action scoring with volume footprint data so day traders can see conviction levels that standard green/red candles hide.

UNDER THE HOOD
This indicator stands apart from simple candle coloring tools by using two distinct analytical layers that work together:
Price Action Analysis evaluates each candle’s structure and compares it to multiple previous candles. Rather than looking at a single bar in isolation, the indicator examines how the current candle’s size and values compare across several prior bars to establish context. This multi-candle approach helps distinguish between genuine momentum and single-bar noise. The analysis considers factors such as whether the candle is extending beyond previous ranges or failing to do so, whether the candle size indicates conviction or indecision, and whether the overall range suggests strength or weakness. Proprietary adjustment algorithms then modify the raw score based on candle characteristics. Smaller, weaker candles receive reduced scores while larger conviction candles receive appropriate emphasis. Gap bars at market open are handled separately to prevent misleading readings from overnight price changes.
Order Flow Analysis uses TradingView’s native volume footprint data, which categorizes volume as buying or selling based on intrabar price movement direction. This data is then normalized using adaptive calculations based on rolling historical averages, allowing the indicator to respond appropriately to current market conditions rather than relying on fixed thresholds that may not suit all instruments or market environments.
The two scores are then blended together based on user preference, creating a combined pressure reading that benefits from both analytical perspectives.
Delta Multiple Circles help you spot when unusually large amounts of directional volume come into the market. Delta is the difference between buying volume and selling volume on a candle. If more volume is on the buy side, the delta is positive (bullish). If more is on the sell side, the delta is negative (bearish).
The indicator uses an adaptive algorithm to calculate an accurate average of the recent delta that adjusts quickly to changing market conditions. When the delta on a candle is significantly larger than that adaptive average, a circle appears near the candle. The bigger the delta compared to the average, the bigger the circle. There are 10 size tiers.
Positive delta circles appear below the candle in the buy color. Negative delta circles appear above the candle in the sell color. Large spikes in directional volume often happen before price fully reacts to that volume. This can help you get into a position early if the volume supports a move, or get out if large volume is coming in against you.
The indicator includes buy and sell signal detection with on-chart arrows and TradingView alerts. A signal fires when a candle’s final score reaches the threshold percentage you set in settings. In addition to the score threshold, the candle must also meet other proprietary conditions determined to be likely indicators of potential continuation in that direction.
Signals are designed to be meaningful rather than frequent, highlighting only the highest conviction candles.
The signal arrows and TradingView alerts have their own independent toggles. You can use arrows only, alerts only, or both together. To receive push notifications, emails, or pop-ups, you still need to set up the alert through TradingView’s alert menu after enabling the alert toggle in the indicator settings. Adjust the threshold percentage to control sensitivity. Higher values produce fewer but more selective signals.
READING THE DATA
The indicator uses a 10-tier gradient in each direction:
The key insight is that candle direction alone does not tell the full story. Strong candles with strong directional volume and movement will show bright colors to represent the strength of that candle’s direction. Weak and indecisive candles will appear darker to indicate that there was a lack of directional conviction.
The colors used can be customized by setting the bullish color, bearish color, and base color. The base color will be mixed with the directional color when directional conviction is low.
HOW TO TRADE WITH IT
Bright colored candles indicate strength and conviction. When you see consecutive bright candles in the same direction, this suggests sustained momentum worth riding. During these moves, consider trailing your stop loss tightly to protect profits while allowing the trend to continue. The brightness of the candles serves as a real-time gauge of how much conviction remains in the move.
Reversals typically do not occur suddenly. Watch for a darkening of colors leading up to potential reversal points. Darker, dimmer candles indicate indecision and combative pressure from both buyers and sellers. When bright candles begin transitioning toward gray or dim colors, especially at key support/resistance levels, this often precedes a change in direction. A sequence like bright → medium → dim → gray suggests momentum is fading and a reversal or consolidation may follow.
Large bright candles appearing at pivot points or key levels often represent strong entry opportunities. These candles show that one side has taken decisive control with conviction. When price reaches a significant support or resistance level and produces a bright candle in the expected direction, this confluence of price level and pressure confirmation can provide higher-probability entries.
One of the most valuable applications involves watching for color-to-direction discrepancies when using volume weighting. If you see a green candle (close above open) but the indicator colors it toward red or gray, this means the underlying volume pressure contradicts the candle’s direction. This divergence suggests the move may be false and could soon reverse. The order flow component is detecting selling pressure despite the bullish candle structure is a warning sign that the apparent strength lacks genuine support.
Extended periods of gray or dim candles indicate low conviction and indecision. These periods often represent consolidation ranges where neither buyers nor sellers have control. Such conditions may precede significant breakouts, making them useful for identifying potential setup zones.
Watch the candle colors and you will notice that in tight ranges, the candles will be darker and rarely have very bright colors, but once price reaches the edges of a range and has multiple bright colored candles, this validates that traders are now ready to move outside of that range and place directional trades. Use the bright colored candles to reveal where traders are interested in entering positions and use that conviction to your advantage.
CONFIGURATION
| Setting | Default | Description |
|---|---|---|
| Price Action Influence % | 50% | Controls the blend between price action scoring and footprint volume scoring. 0% = pure order flow, 100% = pure price action. For futures with excellent volume data, 50% works well. Increase toward 100% for instruments with unreliable volume data |
| Buy Color | Bright Green | Color for bullish pressure candles |
| Sell Color | Red | Color for bearish pressure candles |
| Base Color | Gray | Neutral/base color mixed with directional color when conviction is low |
| Setting | Default | Description |
|---|---|---|
| Enable Delta Multiple Circles | On | Toggle the delta circle feature on or off |
| Circle Buy/Sell Color | Green/Red | Customize colors for positive and negative delta circles |
| Delta Increment | 1.0 | How much extra delta above average is needed per circle size tier. At 1.0, 2x average = smallest circle, 3x = next size up, through 11x for largest. Lower values show circles more often, higher values make them rarer |
| Circle Size Per Tier | 1+ | Controls how visually large each circle tier appears on your chart. Increase if circles are hard to see |
| Setting | Default | Description |
|---|---|---|
| Show Signal Arrows | Off | Toggle buy/sell arrows on the chart. Does not affect alerts |
| Enable Alerts | On | Toggle alert conditions. You still need to create the alert in TradingView's alert menu. Does not affect signal arrows |
| Threshold % | 100% | The candle's final score must reach this percentage of maximum before a signal fires. Higher values produce fewer but more selective signals |
| Signal Buy/Sell Color | Green/Red | Customize colors for buy and sell signal arrows |
Fix Loading Error: Toggle this checkbox if the indicator fails to load, displays incorrectly, or starts lagging. This forces TradingView to restart the indicator.
COMPATIBILITY
The order flow component uses native TradingView footprint data which requires a TradingView Premium subscription (or higher). Consider these guidelines:
Higher timeframes (daily, weekly) typically produce more reliable color readings with less noise. Lower timeframes can be useful for timing entries within the context of higher timeframe analysis.
The indicator requires a brief initialization period of approximately 60 bars for full accuracy as the adaptive calculations populate their historical reference data.
GOOD TO KNOW
GET ACCESS
Access the full Order Flow Pro Suite on your TradingView charts. All 4 indicators with footprint volume data and priority support.
COMMON QUESTIONS
CHANGELOG
Updated the footprint data call parameters to improve performance on tickers with large amounts of ticks per bar.
Major update that integrates TradingView's native footprint data framework for buy/sell volume, adds Delta Multiple Circles for spotting large directional volume, and introduces buy/sell signal arrows with configurable alerts.
EXPLORE THE SUITE
Order Flow Pro
Five analysis tools including buy/sell pressure, absorption, neutral volume, institutional buyer histogram, and cumulative volume delta trend line. Shows the broader market dynamics that complement per-candle scoring.
Order Flow Pro
Detects and labels individual large institutional orders directly on your chart with a four-tier classification system. Use alongside Order Flow Candles to see both the overall pressure gradient and specific institutional entries.
Order Flow Pro
Identifies ranked institutional order block levels from multiple timeframes. Combine with Order Flow Candles to confirm whether candle pressure supports a reaction at detected order block levels.