Order Flow Pro Suite

Institutional Order Flow Indicator for TradingView

Institutional Order Flow indicator on a TradingView chart showing labeled institutional order markers with tier classification

Institutional Order Flow is a TradingView indicator that detects large orders inside every candle using an adaptive threshold algorithm and a four-tier classification system. Built for futures and equities day traders who want to see where institutional participants entered and defended positions without manual tuning per instrument.

The indicator employs a proprietary adaptive algorithm that dynamically calculates volume significance thresholds based on recent market conditions. Rather than relying on static thresholds that require constant manual adjustment across different instruments, this indicator automatically adapts to the unique volume characteristics of whatever you’re trading. What qualifies as a “large order” on ES futures is vastly different from crude oil or gold. This indicator handles that distinction automatically using custom formulas that identify orders representing significant institutional activity.

Built by Lane Dotson · Last updated · View on TradingView →
Part of the Order Flow Pro Suite 4 indicators for $169.99/mo. View all included indicators → See pricing →
Tick-Level Analysis: Institutional Order Flow analyzes granular lower timeframe data(every individual trade within each chart candle) to identify orders that represent significant institutional activity. The proprietary adaptive algorithm dynamically calculates what qualifies as a large order based on current market conditions, eliminating the need for manual threshold adjustment across instruments.

Chart Examples

Tesla 1-minute chart:

Institutional Order Flow indicator on the Tesla 1-minute chart showing labeled institutional order markers
Tesla (TSLA) on the 1-minute chart- institutional order labels displayed with tier classification and size.

MES 1-minute chart:

Institutional Order Flow indicator on the MES 1-minute chart showing institutional order detection on micro futures
Micro E-mini S&P 500 (MES) on the 1-minute chart institutional orders detected using adaptive thresholds.

Silver 1-minute chart:

Institutional Order Flow indicator on the Silver 1-minute chart showing institutional order labels across commodities
Silver futures on the 1-minute chart the adaptive algorithm automatically calibrates thresholds to commodity-level volume.

UNDER THE HOOD

Core Features

Adaptive Threshold Calculation

The core innovation of this indicator is its proprietary method for determining what constitutes a significant order across varying degrees of trading thresholds. The algorithm continuously analyzes recent market activity and calculates dynamic thresholds that adapt to current conditions. During high-activity sessions, thresholds adjust accordingly; during quieter periods, they recalibrate. This means the indicator remains effective across all market conditions without manual reconfiguration.

Four-Tier Classification System

Orders are classified into four distinct tiers based on their significance relative to recent activity:

  • Tier 1: The absolute largest orders. Rare, exceptional institutional activity
  • Tier 2: Very large orders. Substantial activity that stands out clearly
  • Tier 3: Large orders. Notable but more frequent significant volume
  • Tier 4: Significant orders above the baseline threshold

You control which tiers are displayed, allowing you to focus on only the most exceptional orders or cast a wider net to see more activity. Each tier has its own customizable text size, creating an immediate visual hierarchy where the most significant orders are the most prominent.

Top Orders Tracking

The indicator maintains a separate tracking system that records the largest orders detected across your entire chart history of available data. Unlike the tier thresholds which adapt to recent conditions, the Top Orders table shows you the absolute biggest orders ever seen on the chart, giving you a historical reference point for exceptional institutional activity.

The largest orders are also displayed directly on the chart as orange labels with their rank, making it easy to see which orders were the biggest and where price is likely to react. The number of top order labels displayed on the chart and the number of orders shown in the table can be controlled independently. This allows you to show just a few of the largest order sizes in the table for quick reference while displaying more of the biggest order labels on the chart so they are easy to spot. The default displays the top 20 largest order labels on the chart.

Areas of Interest

Areas of Interest are zones detected as having significant concentrated institutional activity. When the indicator identifies a cluster of large orders in a tight price range, it draws a box on the chart showing exactly where the majority of institutional activity took place.

Use these boxes as entry or exit zones. Price is likely to have a reaction when it returns to these areas since institutional participants will be defending or adding to their positions. Combine with price action to confirm your trades.

The sensitivity setting controls how many Areas of Interest are displayed. Lower numbers show more zones but with less certainty of strong price reactions. Higher numbers show fewer zones with higher confidence. The default is calibrated for 1-second data on a 1-minute chart. Adjust to suit your preference and chart settings.

Directional Classification

Each detected order is classified by direction based on price movement. Since TradingView does not provide native directional order data (buy vs. sell), the indicator determines direction by comparing the close price of each lower timeframe bar to the previous close:

  • Bullish (green): Price moved up – associated with buying pressure
  • Bearish (red): Price moved down – associated with selling pressure
  • Neutral: No price change detected

This provides a practical approximation of order direction within the limitations of available data.

It is important to note that price could have moved up or down based on the order book and current available orders, so the classification of buy and sell orders based on price movement is not 100% accurate. The data TradingView provides also does not include entry or exit order classification, so any order shown could be an entry or an exit from a position. To avoid potentially inaccurate directional data, turn off the “Color Labels By Direction” setting.

Smart Label Management

The indicator includes two complementary label shifting systems to keep your chart clean and readable:

  • Manual Shifting: Move all labels horizontally away from candles (left or right) by a customizable number of bars. A connecting line is drawn back to the original price level where the order occurred.
  • Automatic Multi-Order Shifting: When multiple orders from the same tier occur on a single chart bar, labels automatically spread apart to prevent overlap. The first order stays at the bar, while subsequent orders shift incrementally. Each tier maintains its own counter, so Tier 1 and Tier 2 orders shift independently. The shift direction follows your Label Style setting.

Flexible Data Source

Analyze volume from one instrument while viewing price action on another. This is particularly useful when trading micro contracts where the full-size counterpart has more reliable institutional order detection due to higher liquidity.

THE PROCESS

How It Works

The indicator requests data from a timeframe smaller than your chart timeframe using TradingView’s lower timeframe data functions. For example, on a 5-minute chart with tick data selected, the indicator retrieves every individual trade that occurred within each 5-minute candle.

This granular data is processed through a proprietary adaptive algorithm that:

  1. Maintains awareness of recent volume patterns for the instrument
  2. Calculates dynamic thresholds that define what qualifies for each tier
  3. Compares each incoming order against these thresholds
  4. Displays qualifying orders as labels at their corresponding price levels
  5. Tracks the largest orders seen across all chart history separately
  6. Detects concentrated clusters of institutional activity and marks them as Areas of Interest

The adaptive nature of the threshold calculation ensures thresholds remain meaningful regardless of the instrument, trading session, or market environment. No manual tuning required.

HOW TO TRADE WITH IT

Trading Applications

The most effective approach involves patience and precision.

Identify Clusters of Top-Tier Orders

When you observe multiple Tier 1 or Tier 2 orders occurring at similar price levels, this creates a cluster zone of significant institutional interest. These clusters often represent areas where large participants have accumulated or distributed positions. Mark these levels for future reference and place entries in the direction of the large buyers with your orders at or very close to the same price of the large orders. Many times these institutional buyers will defend their orders and price will have a significant reaction from those price levels that you can take advantage of.

Wait for Price to Return

After identifying a cluster zone, the key is patience. When price moves away from these areas and later returns, you have a high-probability setup developing. Areas where institutional-sized orders previously executed often act as support or resistance because large participants who entered at these levels have a vested interest in defending their positions. Look to scalp profits from the reaction at these levels. Use the Order Block Indicator along with Institutional Order Flow to verify which levels are the most important and will likely have a price reaction.

Execute Scalp Trades on the Retest

When price approaches a previously established cluster zone, look for a bounce trade in the direction that price approached from:

  • If price drops DOWN into a cluster zone, look for a LONG scalp as price bounces
  • If price rises UP into a cluster zone, look for a SHORT scalp as price rejects

Trade Areas of Interest

Areas of Interest boxes highlight zones where concentrated institutional activity was detected. When price returns to these zones, watch for reactions. Institutional participants who entered at these levels will often defend or add to their positions. These zones are excellent for scalp entries, especially when combined with price action confirmation like large wicks or candlestick patterns at the zone boundary.

Multi-Market Confluence

For additional confirmation, consider using two instances of this indicator pulling Tier 1 data from correlated markets. For example, monitoring both ES and NQ or NQ and MNQ for significant orders can reveal when institutional activity is occurring across multiple indices simultaneously, providing stronger confluence for your trade decisions.

CROSS MARKET ANALYSIS

Using the Data Source Feature

The Data Source setting allows you to analyze volume from a related instrument while viewing price on another. Common applications:

  • View MES chart → Analyze ES volume data
  • View MNQ chart → Analyze NQ volume data
  • View M2K chart → Analyze RTY volume data

This provides cleaner institutional order detection since full-sized contracts typically have higher volume and more obvious large order activity.

Another way to use this feature is to add a second instance of the indicator to your chart and set the second one to another similar asset so you can see coordinated trading across different tickers such as GC and MGC, NQ and MNQ, ES and MES, or you can mix and match by looking at data from NQ and ES on the NQ chart. Change the label and info table text colors of the second indicator to a different color to be able to tell the difference between which ticker each order came from.

How labels are drawn with external data sources: When you set the data source to a different ticker, the indicator looks for institutional orders on the external ticker and then draws the label at the price the chart ticker was at when the institutional order came in. For example, if you are pulling data from ES when viewing an NQ chart and a Tier 1 order comes in while NQ is at $26,634, the label will appear with the order size from ES at $26,634 on the NQ chart on the exact bar that it happened.

CONFIGURATION

Settings Overview

Main Settings

Setting Default Description
Label Style Left Controls label positioning relative to bars (Left, Right, Center, Above, Below)
Data Source (empty) Optionally specify a different symbol for volume analysis (e.g., ES1! while viewing MES)
Lower Timeframe 1S Granularity for data collection. 1S (1-second) provides more history than tick data. Use 1T for maximum accuracy with less history
Order Tiers to Display 1 & 2 Choose which tier levels appear on your chart (Tier 1 through Tier 4)
Order Size Filter Off Optional absolute minimum volume threshold (works in combination with tiers)
Color Labels By Direction Off Toggle directional coloring (green/red/neutral) on or off. Off by default since the default LTF is 1S rather than tick data

Areas of Interest Settings

Setting Default Description
Areas of Interest On/Off On Enable or disable Areas of Interest zone boxes
Sensitivity 3 Lower numbers show more zones with less certainty; higher numbers show fewer zones with higher confidence. Default is calibrated for 1S data on a 1-minute chart
Box Color Aqua Color of the Areas of Interest zone boxes
Box Border Color Aqua Border color for zone boxes
Box Border Line Width 1 Thickness of box border lines
Box Extension (Bars) 20 How many bars to the right each zone box extends

Label Styling

  • Directional colors for up/down/neutral movement
  • Independent text size settings for each tier (Tier 1 through Tier 4)
  • Label text color and non-directional background color
  • Manual label shifting: Move all labels left or right by a set number of bars
  • Automatic multi-order shifting: When multiple orders from the same tier occur on one bar, each additional order shifts incrementally to prevent overlap (configurable increment)

Info Table Settings

The Info Table displays real-time information including the current lower timeframe being analyzed, current threshold values for Tier 1, Tier 2, and Tier 3, size filter status (value or “Off”), and the data source symbol being used. Fully customizable position, colors, and text size.

Top Orders Table Settings

Setting Default Description
Number Of Top Orders In Table 5 How many of the largest orders to display in the Top Orders table (1–20). Use a smaller number for quick reference
Number Of Top Order Labels On Chart 20 How many of the largest orders to display as orange ranked labels on the chart. Controlled independently from the table count so you can show more labels on the chart for easy spotting
Table Position Top Right Position of the Top Orders table on the chart
Colors & Text Size Varies Customize table background, text colors, and font size

GOOD TO KNOW

Important Notes & Limitations

Warmup period required. The indicator needs sufficient historical data before displaying labels. Until enough lower timeframe data has been collected, labels will not appear and tier thresholds may show "N/A" in the Info Table.
Historical data is limited for tick-level and second-level data on TradingView. The indicator works best on recent data where granular timeframes are available.
TradingView restricts indicators to 500 labels and 500 lines maximum. During extremely active periods, not all qualifying orders may be displayed. Consider restricting to fewer tiers if you encounter this limitation.
This is a volume analysis proxy: it analyzes volume at price levels from standard OHLCV data. It is not order book data, level 2 data, or footprint chart data. It provides a technical proxy for identifying significant volume events.
Direction detection is an approximation. TradingView does not provide native buy/sell or entry/exit order classification. Direction is determined by comparing consecutive close prices. Turn off "Color Labels By Direction" to avoid potentially inaccurate directional data.
Fix loading errors: If the indicator fails to load or displays incorrectly, toggle the "Fix Indicator Loading Error" setting on then off to force TradingView to restart the indicator.

GET ACCESS

Get Institutional Order Flow
Plus 3 More Order Flow Tools

Access the full Order Flow Pro Suite on your TradingView charts – all 4 indicators with volume footprint data and priority support.

$169.99/month · Cancel anytime · Try it: $99.99 for 2 weeks
All Future Updates
Volume Footprint Data
Chart Templates
Video Walkthroughs
Priority Support

COMMON QUESTIONS

Frequently Asked Questions

The default lower timeframe is set to 1S (1-second), which requires a TradingView Premium or Ultimate subscription. For tick-level data (1T), you need a TradingView Ultimate subscription. If you only have a basic paid plan with access to minute-level data, you can change the lower timeframe to 1-minute. The indicator will still function but with less granular detection.
Institutional Order Flow focuses specifically on detecting and labeling individual large orders directly on your price chart, with a four-tier classification system and ranked top orders tracking. The Order Flow Indicator provides five separate histogram and trend line tools displayed in panes below your chart, including buy/sell pressure, absorption, neutral volume, institutional buyer detection, and cumulative volume delta. They analyze different aspects of order flow and complement each other well.
Direction is an approximation based on comparing consecutive close prices in the lower timeframe data. It is not the same as true exchange-classified buy/sell data. The approximation works well in practice but is not 100% accurate. Price can move up or down based on order book dynamics independent of whether the order was a buy or sell. If accuracy concerns you, turn off "Color Labels By Direction" and focus on order size and location rather than direction.
Areas of Interest are zones where the indicator detects concentrated institutional activity(multiple significant orders clustered in a tight price range). They appear as boxes on your chart. Use them as entry or exit zones when price returns to these areas, since institutional participants often defend or add to their positions at these levels. Combine with price action confirmation for best results. Adjust the sensitivity setting to control how many zones are displayed.
Yes. Use the Data Source setting to specify a different symbol. The indicator will detect institutional orders on the external ticker and draw labels at the price your chart ticker was at when each order occurred. This is useful for trading micro contracts while analyzing the full-size counterpart's volume, or for seeing coordinated institutional activity across correlated markets like ES and NQ.

CHANGELOG

Release Notes

External Data Source Improvements & Top Order Label Controls

Improved reliability when pulling data from external tickers, overhauled real-time label handling, and added independent controls for top order table entries versus chart labels.

What Changed
Updated functionality when pulling data from other tickers and improved reliability of order levels from external data sources
Improved drawing of real-time labels, ranking of largest order labels, updating largest order labels, and handling differences between real-time and historical labels
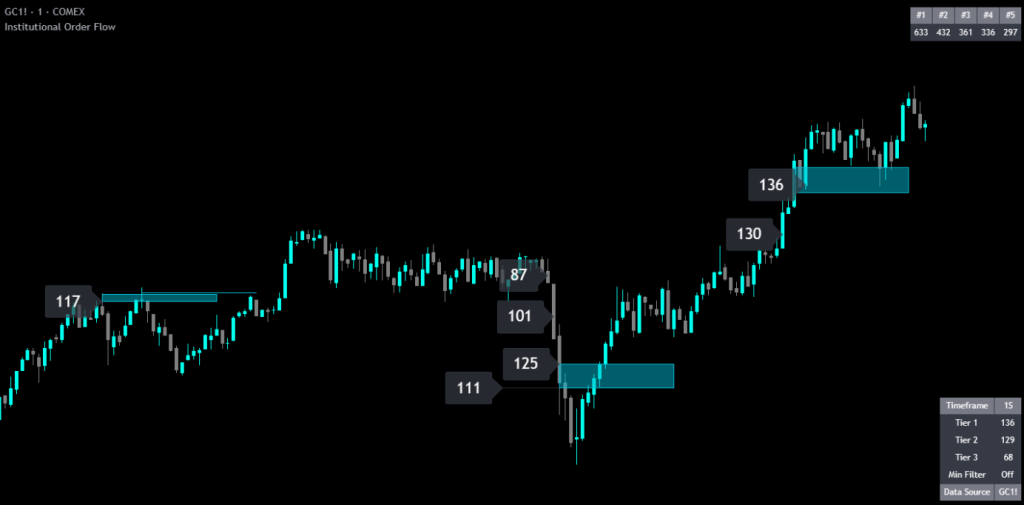
Number of top orders in the table and number of top order labels on the chart can now be controlled independently. Show a few in the table for quick reference and more labels on the chart for easy visual spotting
Default number of top order chart labels changed to 20 (now adjustable)
Minor code change
Areas of Interest Feature

Added a new feature that detects zones of concentrated institutional activity and displays them as box overlays on your chart.

What Changed
New "Areas of Interest" feature: Detects zones with significant concentrated institutional activity and draws boxes showing where the majority of large order activity took place
Configurable sensitivity setting: Lower numbers show more zones, higher numbers show fewer but higher-confidence zones
Adjustable box color, border color, border line width, and extension bars
Real-Time Update Bug Fix

Fixed a small bug with real-time updates.

What Changed
Fixed real-time data update bug
Default Settings Update & Top Orders Chart Labels

Updated defaults to show only the most important data and added ranked top order labels directly on the chart.

What Changed
Default lower timeframe changed to 1S for more historical data availability
Directional label coloring turned off by default since the default LTF is no longer tick data
New top orders chart labels: The largest orders appear as orange labels with their rank directly on the chart. Number of top labels adjustable in Top Orders Table Settings
Show older updates
External Data Source Fix & Clarification

Fixed price coordinate issue when pulling data from other tickers. When using an external data source, labels are drawn at the chart ticker's price at the time the institutional order occurred on the external ticker — not at the external ticker's price.

What Changed
Fixed price coordinate mapping for external data source labels
External Data Source Bug Fix

Fixed a small bug when pulling data from other charts.

What Changed
Fixed bug with external data source retrieval

EXPLORE THE SUITE

Related Indicators

Order Flow Pro

Five analysis tools including buy/sell pressure, absorption, neutral volume, institutional buyer histogram, and cumulative volume delta trend line. Shows the broader order flow dynamics that complement individual institutional order detection.

Order Flow Pro

Identifies ranked institutional order block levels across three tiers from multiple timeframes. Combine with Institutional Order Flow to verify which levels have the heaviest large-order concentration.

Order Flow Pro

Scores each candlestick on your price chart with a directional grade based on its internal order flow composition. Use alongside institutional order labels to confirm the overall directional bias at large-order levels.