Free Indicator

VWAP Multi-Timeframe for TradingView

VWAP Multi-Timeframe indicator showing multiple VWAP lines from 15 minutes to yearly with trend coloring and a trend direction table on a TradingView chart

VWAP Multi-Timeframe is a free TradingView indicator that plots volume-weighted average price across 14 timeframes (15 minutes through yearly). It includes an external trend direction output (1, -1, 0) for filtering signals on other indicators, a trend table, and optional trend coloring. Every line, label, and color is individually customizable.

Built by Lane Dotson · Last updated · View on TradingView →
This is a free indicator - Add it to your TradingView charts at no cost.
Add to TradingView →

WHAT IT DOES

Core Features

14 VWAP timeframes plus a trend direction output, trend table, trend coloring, and full customization across every line, label, and color.

14-Timeframe VWAP

The indicator plots VWAPs for 14 timeframes: 15 min, 30 min, 1H, 2H, 4H, 6H, 8H, 12H, daily, weekly, monthly, quarterly (3M), semi-annual (6M) and yearly. Each VWAP resets at the start of its corresponding time period. Use lower timeframes for short-term trend control areas and higher timeframes for long-term trend control areas. Each VWAP can be individually toggled on or off.

How VWAP Works

Each VWAP takes the volume-weighted average of price (default source: HLC3 is the average of high, low and close) for every bar since the start of its reset period. Higher-volume bars pull the VWAP closer to current price, indicating heavy institutional activity at those levels. These VWAP lines act as dynamic support and resistance. Trade long when price is above the VWAPs and short when below.

External Trend Direction Output

The indicator outputs a value of 1 (bullish) when price is above all enabled VWAPs, -1 (bearish) when below all enabled VWAPs, and 0 (neutral) when price is between them. This value is labeled “VWAP Multi-Timeframe: Trend Direction To Send To External Indicators” in the data window. Use it to filter other signal-generating indicators so they only give signals in the direction of the VWAP trend.

Trend Table

A display table shows whether price is currently above or below each of the major VWAPs (daily, weekly, monthly, yearly). The table position, background color and text colors are all customizable.

Trend Coloring

Each VWAP can display trend coloring between the VWAP line and the candle close price. It will show green when price is above the VWAP, red when below. This gives you an instant visual read on your trend position relative to each timeframe’s VWAP.

INTERPRETATION GUIDE

How to Trade With Multi-Timeframe VWAP

Reading the Levels

Intraday Scalping With VWAPs

When price is above the daily VWAP but below the intraday VWAPs (like the 4H), you can take small scalp trades within the range the VWAPs create. The daily VWAP tells you the overall trend direction while the intraday VWAPs give you tighter support and resistance to trade between.

Using the Trend Filter

Connect the trend direction output to your signal-generating indicators. When the VWAP trend is bullish (output = 1), your signal indicator only fires buy signals. When bearish (output = -1), only sell signals. This prevents signals that go against the VWAP trend and improves your win rate.

CONFIGURATION

Settings Overview

The indicator is extensively customizable. Here are the key settings.

Main Settings

Setting Default Description
Source HLC3 The price source used for all VWAP calculations. HLC3 = (High + Low + Close) / 3.
VWAPs On/Off (14) Varies Toggle each of the 14 VWAP timeframes individually. Only enabled VWAPs affect the trend direction output.
Labels On/Off On Toggle labels per VWAP or all at once. Adjustable offset and text color.
Trend Coloring On Toggle trend coloring per VWAP. Customizable up and down colors.
Trend Table On Toggle the trend direction display table. Position, background and text colors all customizable.
Line Colors & Widths Varies Customize the color and thickness of each individual VWAP line.

GOOD TO KNOW

Important Notes & Limitations

Requires volume and price data. Tickers without volume will not produce accurate VWAP calculations.
The trend direction output only considers VWAPs that are currently turned on. Toggling VWAPs on or off changes the output value.
Using the external trend filtering feature requires programming your other indicators to read the trend direction value. See the signal filtering guide for instructions.

FREE ON TRADINGVIEW

VWAP Multi-Timeframe is Free to Use

Add it to your TradingView charts and start trading with 14 timeframes of volume-weighted support and resistance today. No subscription required.

100% Free
No Account Required
All Future Updates

COMMON QUESTIONS

Frequently Asked Questions

14 timeframes: 15 min, 30 min, 1H, 2H, 4H, 6H, 8H, 12H, daily, weekly, monthly, quarterly (3M), semi-annual (6M) and yearly. Each can be individually toggled on or off.
It outputs 1 (bullish) when price is above all enabled VWAPs, -1 (bearish) when below all enabled VWAPs, and 0 (neutral) when mixed. Other indicators can read this value as a trend filter to only generate signals in the VWAP trend direction.
VWAP Multi-Source uses 4 different price sources (close, open, high, low) on the daily session to create a VWAP zone. This indicator uses a single source (default HLC3) across 14 different timeframes. Use both together for source-based and timeframe-based VWAP reference on the same chart.
Yes, you'll need to program your other indicators to read the trend direction value. The output is already built into this indicator, you just need to reference it as a source in your signal indicator. See the signal filtering guide for step-by-step instructions.
Any chart that provides volume and price data on TradingView such as stocks, crypto, futures, forex and more. Tickers without volume data will not produce accurate VWAP calculations.

CHANGELOG

Release Notes

VWAP Education & Trading Guide

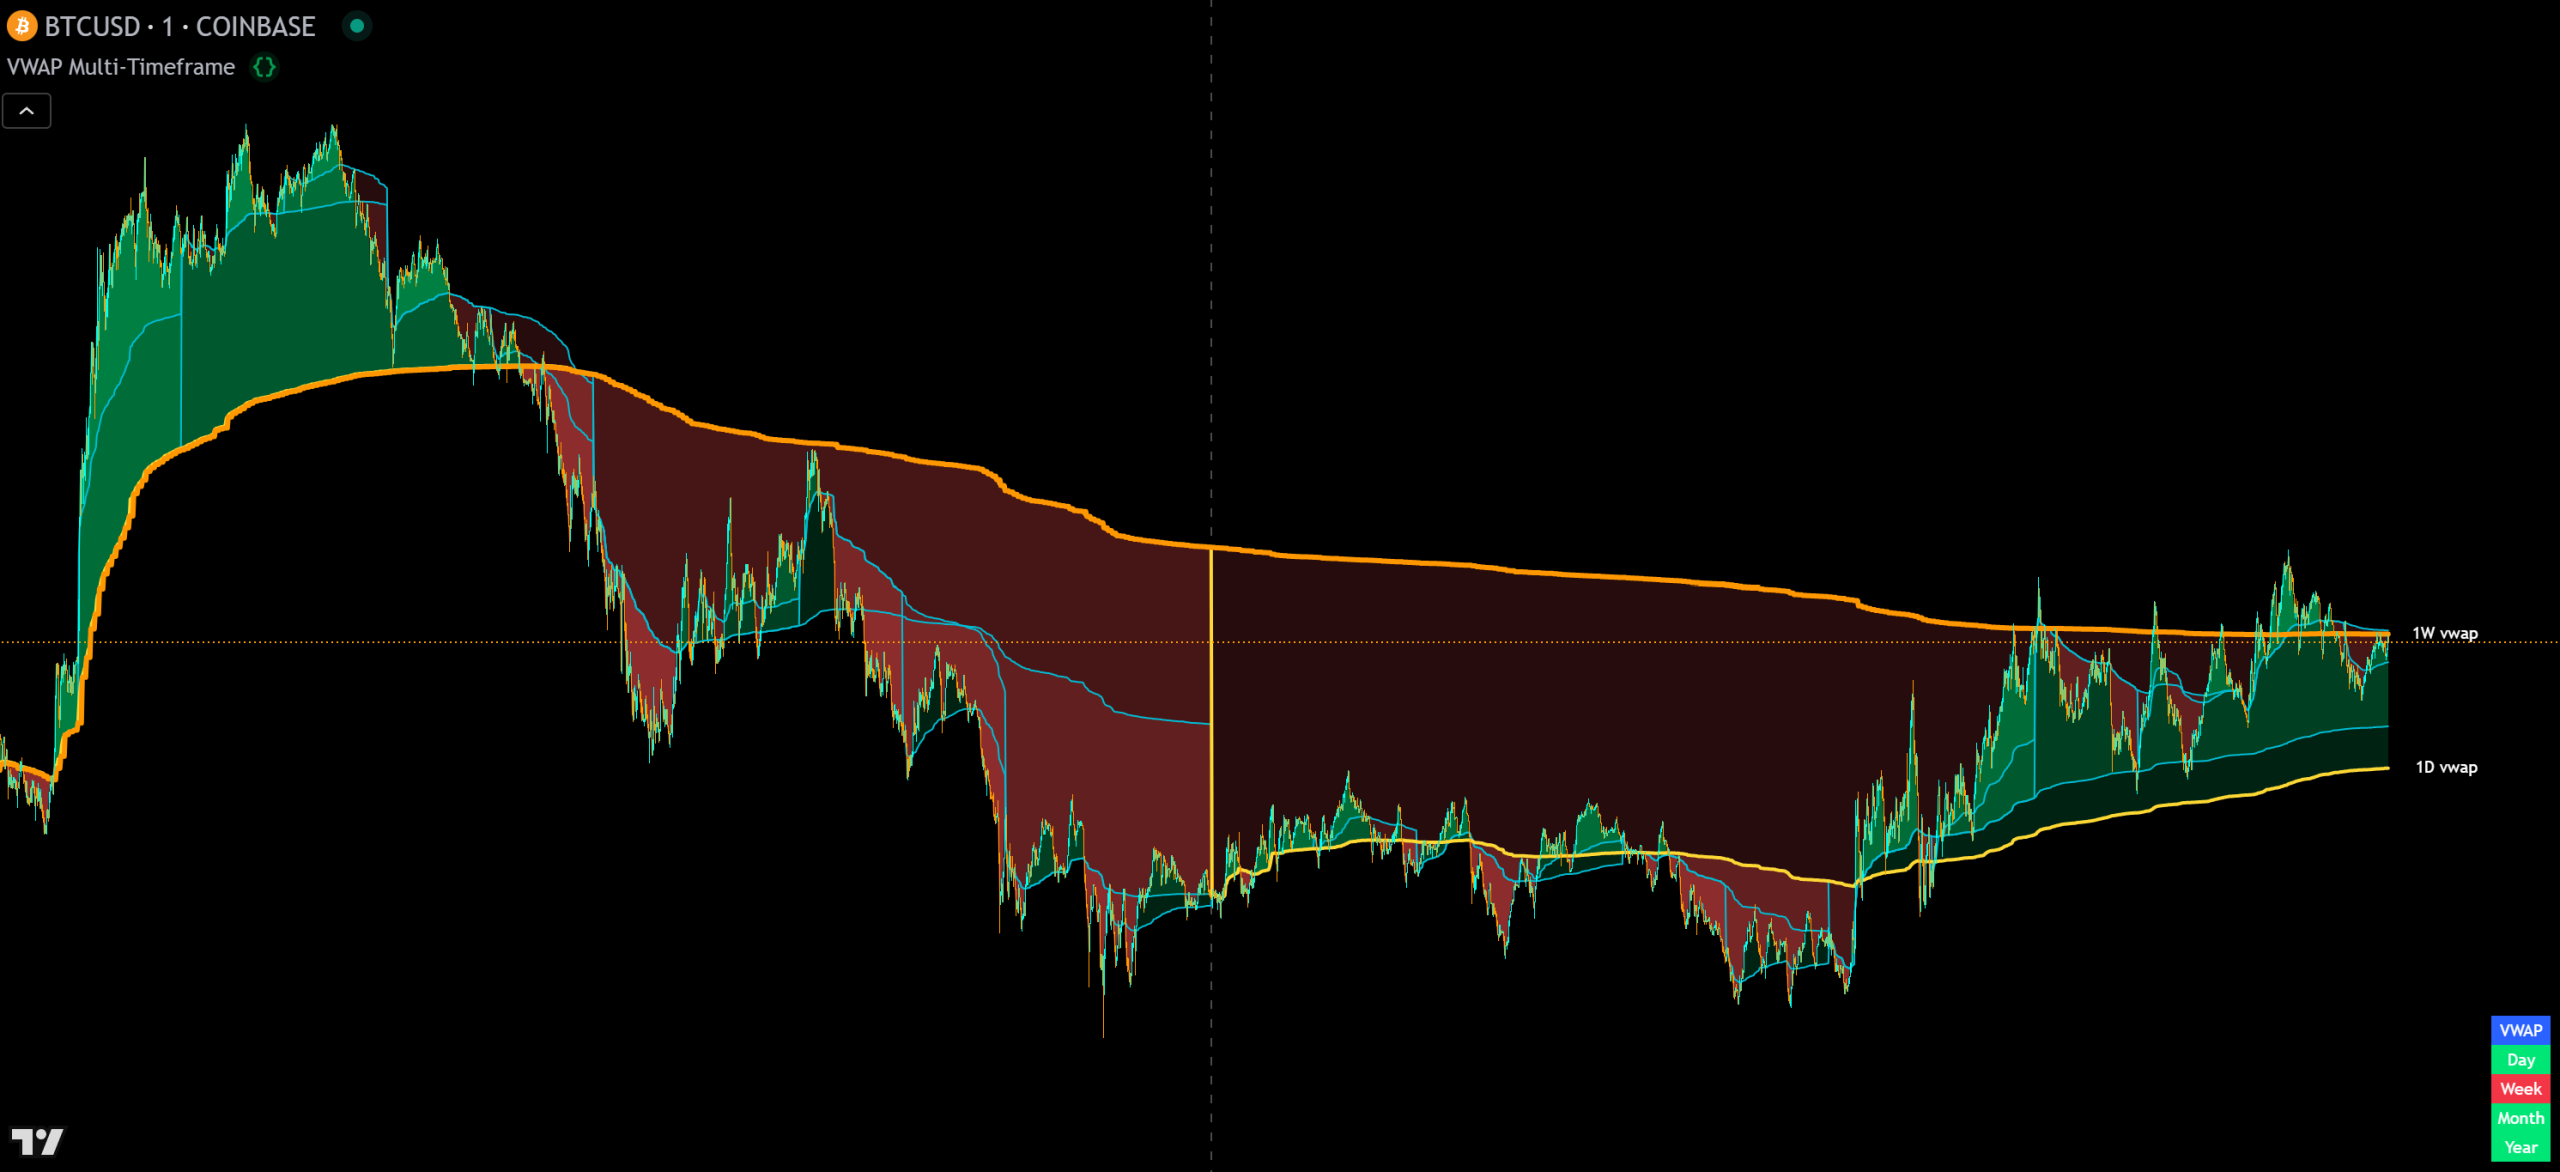
Added a detailed explanation of how VWAP is calculated and how to use the levels for scalping within VWAP ranges.

What Changed
Added educational section explaining VWAP calculation methodology
Added intraday scalping strategy guidance using multi-timeframe VWAP ranges
Show older updates
Initial Release

First public release of VWAP Multi-Timeframe with 14 VWAP timeframes, external trend direction output, trend table, trend coloring and full customization.

What's Included
14 VWAP timeframes from 15 min to 1 year
External trend direction output (1, 0, -1) for filtering signal indicators
Trend table showing price position vs. daily, weekly, monthly and yearly VWAPs
Trend coloring per VWAP with customizable up/down colors
Full customization: source, colors, line widths, labels, table position

EXPLORE MORE

Related Indicators

Free

Four VWAPs from different price sources (close, open, high, low) with a cloud and percentage gap. Use alongside multi-timeframe VWAP for both source-based and timeframe-based VWAP reference.

Free

VWAP/VWMA hybrid with percentage deviation bands. Layer the reversal bands with multi-timeframe VWAPs for complete volume-weighted support and resistance coverage.

Free

Multi-timeframe trend strength with scored dots and an external trend direction output. Both this and VWAP Multi-Timeframe output 1/-1/0. Use them together for a multi-source trend filter.