Label Toggle
Added the ability to turn the bullish/bearish label on or off for better viewing on the mobile app or for users who prefer a cleaner display.
What Changed
• Added on/off toggle for the bullish/bearish trend label
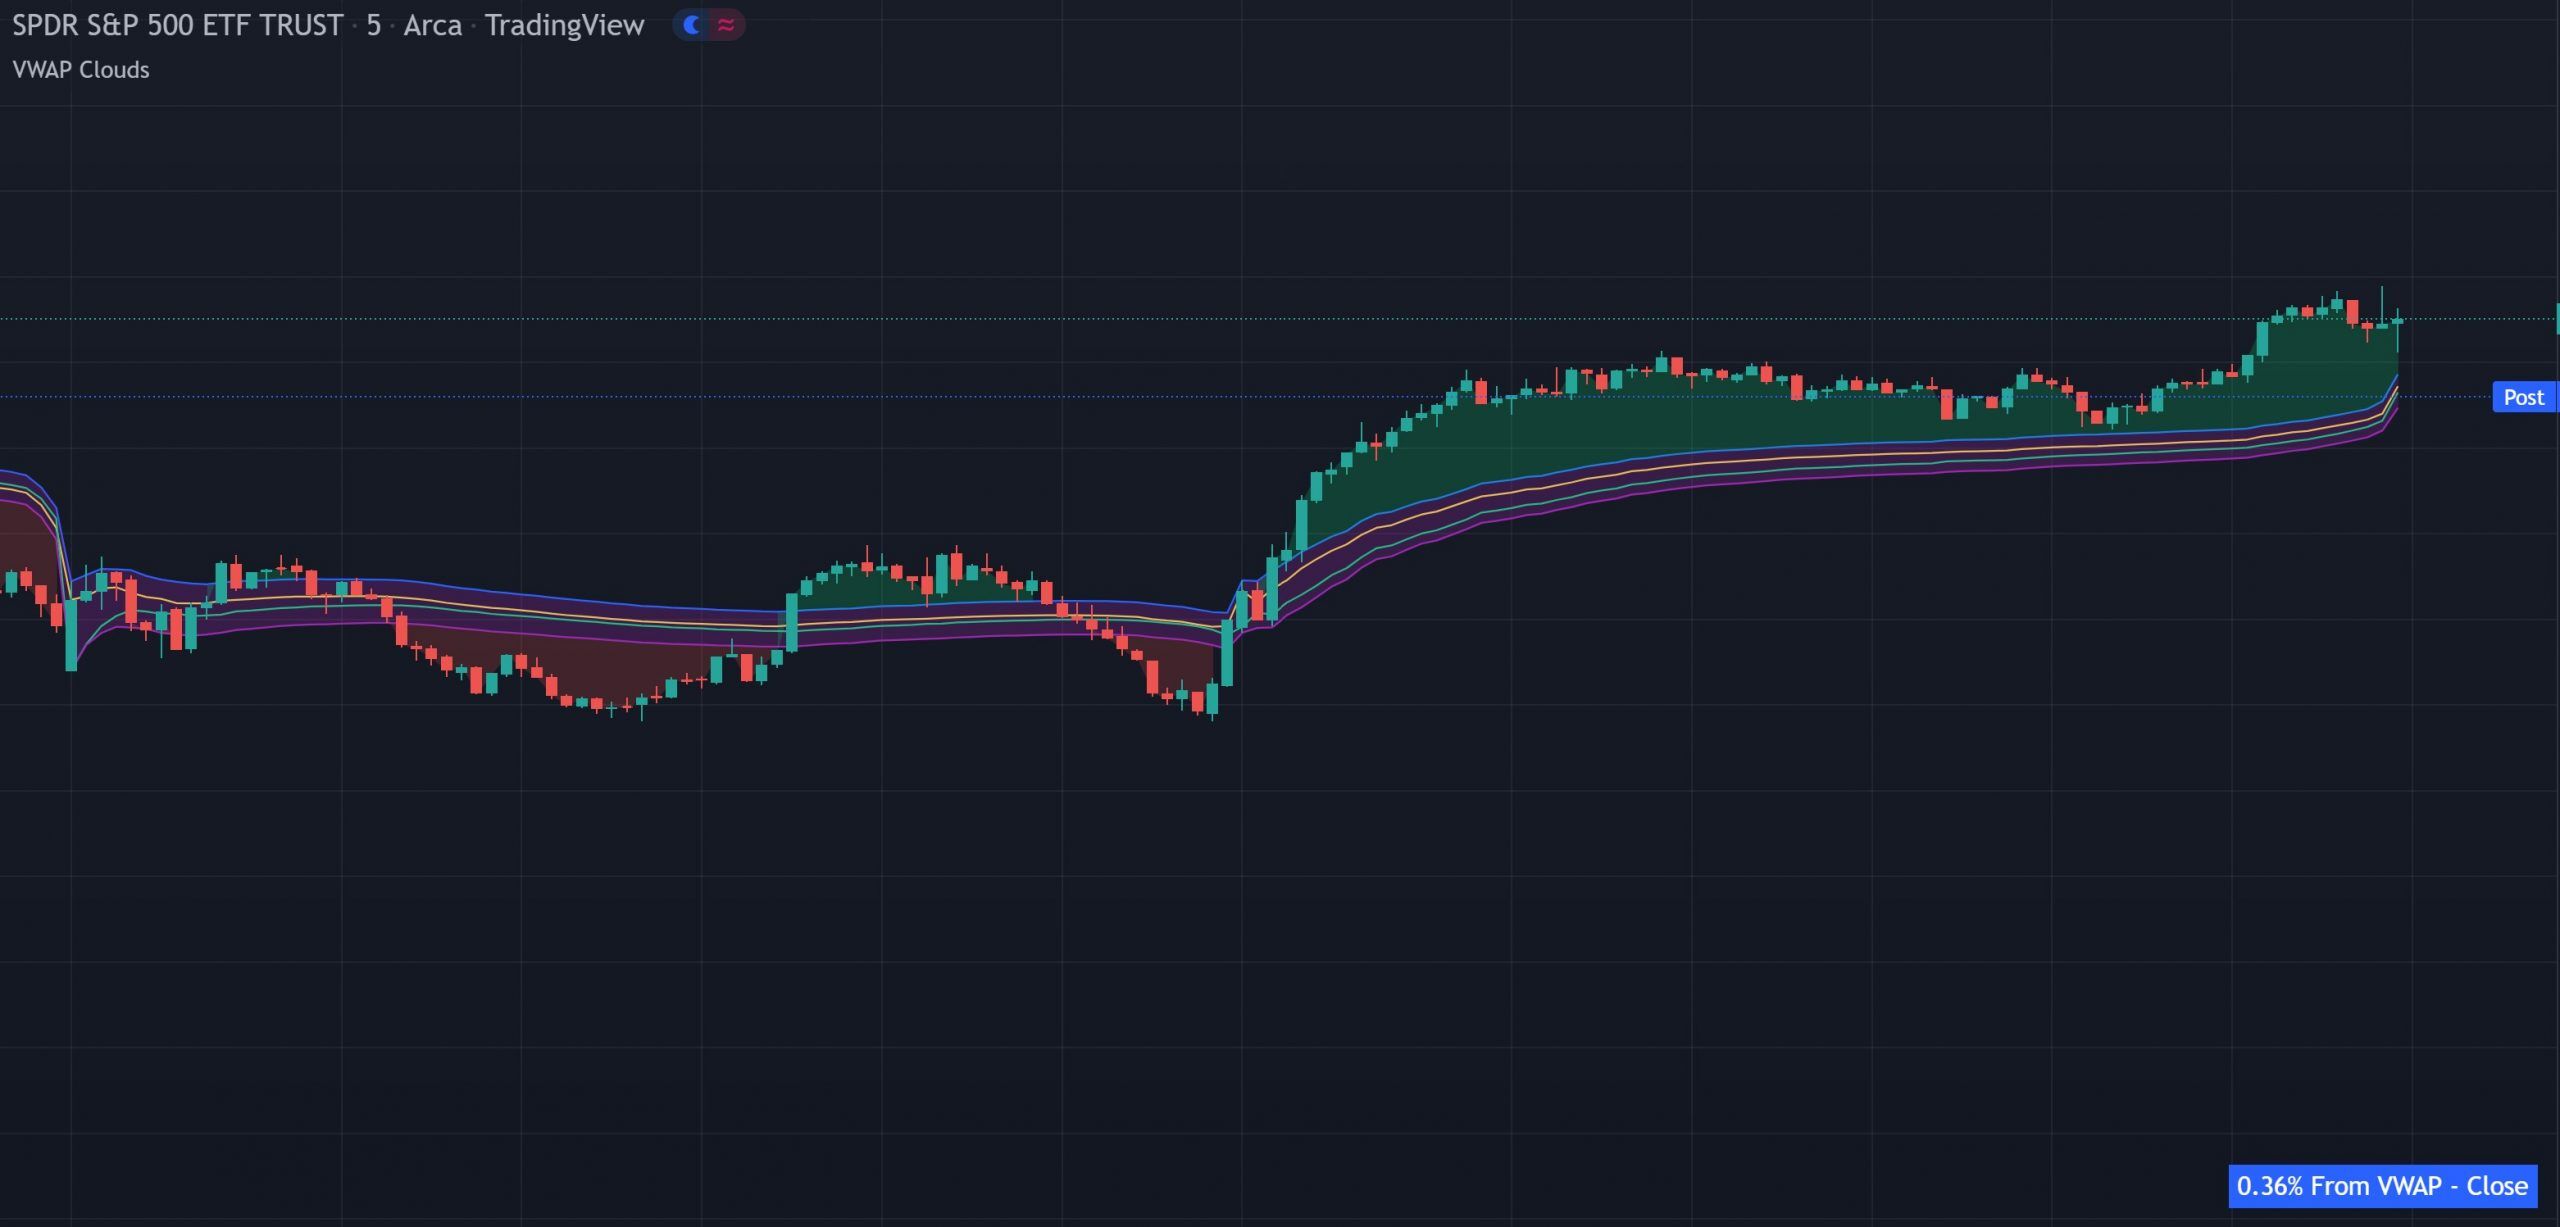
The VWAP Multi-Source indicator plots four VWAPs from close, open, high, and low price sources, creating a cloud that acts as a dynamic support and resistance zone on TradingView. It includes trend background coloring, a real-time percentage gap table, and a toggleable label. Calculated on the daily session. Works on all markets and timeframes.
WHAT IT DOES
Four VWAPs from different price sources with a cloud, trend background and a real-time percentage gap, giving you a VWAP zone instead of a single line.
The indicator plots four separate VWAP lines, each calculated from a different price source: close (yellow), open (green), high (blue) and low (purple). Together, these lines create a VWAP zone that shows you the full range of volume-weighted average prices across all four standard sources. All source assignments and colors can be changed in the settings.
A purple cloud forms between the VWAP lines, creating a visual entry zone. Price will typically bounce from this cloud area. Use the cloud as your primary reference for entries. When price pulls back into the cloud and holds, it’s a strong area for entries in the direction of the trend.
When price is above the VWAP cloud, the background paints green, the trend is bullish. When price is below the VWAP cloud, the background paints red, the trend is bearish. This gives you an instant visual read on which side of VWAP the market is trading on.
A table in the bottom right corner shows the current percentage gap between the current price and the VWAP using close as the source. This tells you how extended price is from the volume-weighted average. The further the gap, the more likely a mean reversion move back toward VWAP.
The bullish/bearish label can be turned on or off for better viewing on mobile or a cleaner display.
INTERPRETATION GUIDE
Use the purple cloud between the VWAPs as your entry zone. When price pulls back into the cloud during a trend, it represents a volume-weighted mean area where price tends to bounce. Enter in the direction of the background color (green = long, red = short) when price touches or enters the cloud. The percentage gap table helps you gauge how extended price is. A large gap means price is stretched and more likely to return to the cloud.
CONFIGURATION
All sources and colors are customizable.
| Setting | Default | Description |
|---|---|---|
| VWAP Sources (4) | Close, Open, High, Low | The price source for each of the 4 VWAP lines. Can be reassigned to any source. |
| Labels On/Off | On | Toggle the bullish/bearish trend label on or off. |
| Colors | Yellow / Green / Blue / Purple | Customize all VWAP line colors, cloud color and background colors. |
GOOD TO KNOW
FREE ON TRADINGVIEW
Add it to your TradingView charts and start trading the VWAP cloud zone today. No subscription required.
COMMON QUESTIONS
CHANGELOG
Added the ability to turn the bullish/bearish label on or off for better viewing on the mobile app or for users who prefer a cleaner display.
EXPLORE MORE
Free
VWAPs from different timeframes (daily, weekly, monthly). Use alongside the multi-source VWAP for both source-based and timeframe-based VWAP reference on the same chart.
Free
VWAP/VWMA hybrid with percentage deviation bands. When the multi-source cloud and the reversal bands align at the same level, you have strong volume-weighted confluence for reversals.
Free
Percentage-based support and resistance with wick rejection signals. Layer with the VWAP cloud to see where traditional S/R and volume-weighted levels overlap.