Chart Image Update
Updated the TradingView publication chart image to explain why there are two indicators on the chart and what they mean.
What Changed
• Updated chart image with annotations explaining the two-indicator setup
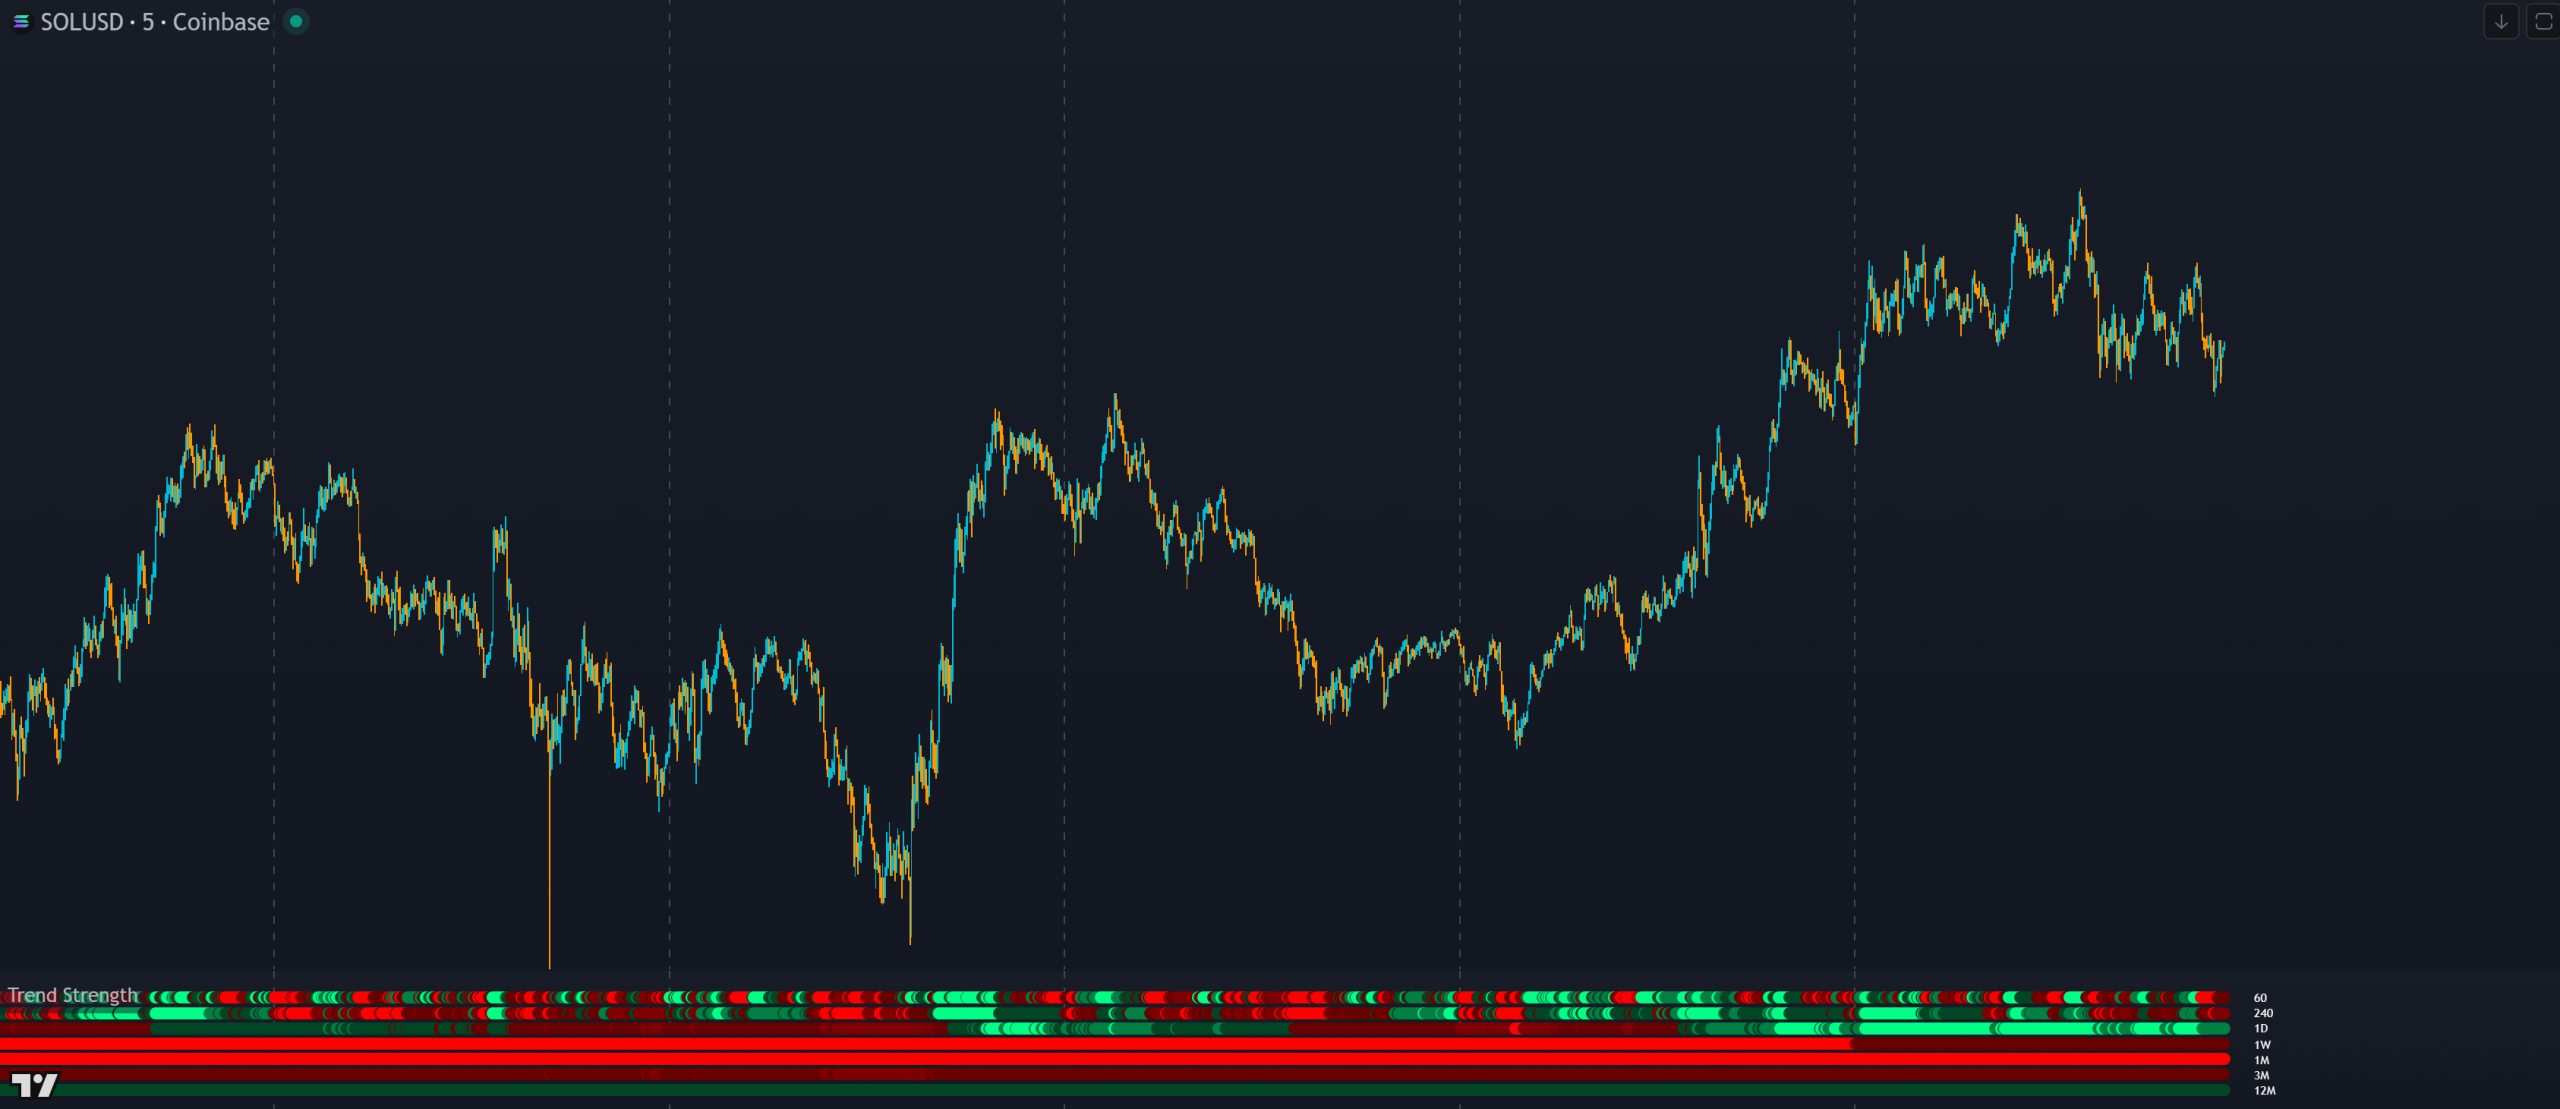
Trend Strength is a free TradingView indicator that shows current and historical trend direction across up to 7 higher timeframes as rows of color-coded dots. Brighter colors mean stronger trend. It includes two scoring modes, an external trend filter output for other indicators, timeframe labels and alerts.
WHAT IT DOES
A visual multi-timeframe trend strength indicator with scored dots, two scoring modes, an external trend filter output and alerts, showing trend direction and strength at a glance across up to 7 higher timeframes.
Each of the 7 available timeframes displays a row of dots that update historically and in real time. Each dot is colored based on where the current candle close is relative to the previous higher timeframe candle. Brighter green means stronger bullish trend. Brighter red means stronger bearish trend. This gives you a visual timeline of trend strength across multiple timeframes so you can see how the trend has evolved and where it stands now.
The scoring works the same as the Breakout Scanner and Higher Timeframe Candle Levels. A score of 1 (dark green) means price is above the midline. A score of 2 (medium green) means above the candle body. A score of 3 (bright green) means above the high, full breakout. The same logic applies in reverse: -1, -2, -3 with increasing shades of red.
You can choose between two scoring modes in the settings. The default “Open, High, Low, Close + Midline” mode uses the full candle structure for detailed scoring (1 to 3). The “Midline Only” mode simplifies to above or below the midline for quick binary trend identification. Switch between modes depending on whether you need detail or speed.
Labels appear to the right of each row of dots identifying which timeframe each row represents, so you can quickly tell which row belongs to which higher timeframe.
You can set alerts for when all enabled timeframes are bullish or all are bearish. Only timeframes that are turned on at the time of alert creation are required to agree. Set alerts to “once per bar close” to avoid premature notifications.
INTERPRETATION GUIDE
Watch for the lower timeframe dots to start changing color after a strong trend in one direction. The lower timeframes will shift one by one, indicating the trend is actually changing direction. This gives you early warning of a reversal before the higher timeframes confirm it.
If you’re scalping on a 1-min to 15-min chart, turn off the higher timeframes and just use 1 hour through 1 day.
Trend Strength, Higher Timeframe Candle Levels and Breakout Scanner all use the same levels and scoring system. Use Higher Timeframe Candle Levels to see the exact levels on your chart. Use the Breakout Scanner to find which tickers are trending strongest across multiple markets. All three are designed to work together.
CONFIGURATION
The indicator is fully customizable. Here are the key settings.
| Setting | Default | Description |
|---|---|---|
| Timeframes (up to 7) | Varies | Up to 7 higher timeframes to display. Each can be individually toggled. Keep all set higher than your chart timeframe. |
| Scoring Mode | OHLC + Midline | Choose between full OHLC + Midline scoring (1 to 3) or Midline Only for quick binary trend identification. |
| Trend Score Threshold | 1 | The minimum score all timeframes must meet to send a bullish or bearish signal to external indicators. Options: 1, 2 or 3. |
| Colors | Green / Red | Customize the bullish and bearish dot colors. |
GOOD TO KNOW
FREE ON TRADINGVIEW
COMMON QUESTIONS
CHANGELOG
Updated the TradingView publication chart image to explain why there are two indicators on the chart and what they mean.
First public release of the Trend Strength Indicator with multi-timeframe trend dots, two scoring modes, external trend direction output, labels and alerts.
EXPLORE MORE
Free
Plots the actual candle levels used to calculate trend strength scores on your chart. See where the midline, body and high/low are that each dot scores against.
Free
Multi-ticker breakout scanner using the same scoring system across 4 timeframes for up to 10 tickers. Find which markets are trending strongest while Trend Strength shows you the depth of the trend on your current chart.
Free
8 configurable moving averages with an external trend direction output. Combine with Trend Strength’s external output to build a multi-source trend filter for your signal indicators.