Label Toggle
Added the ability to turn the bullish/bearish labels on or off for better viewing on the mobile app or for users who don't want the labels displayed.
What Changed
• Added on/off toggle for the bullish/bearish labels
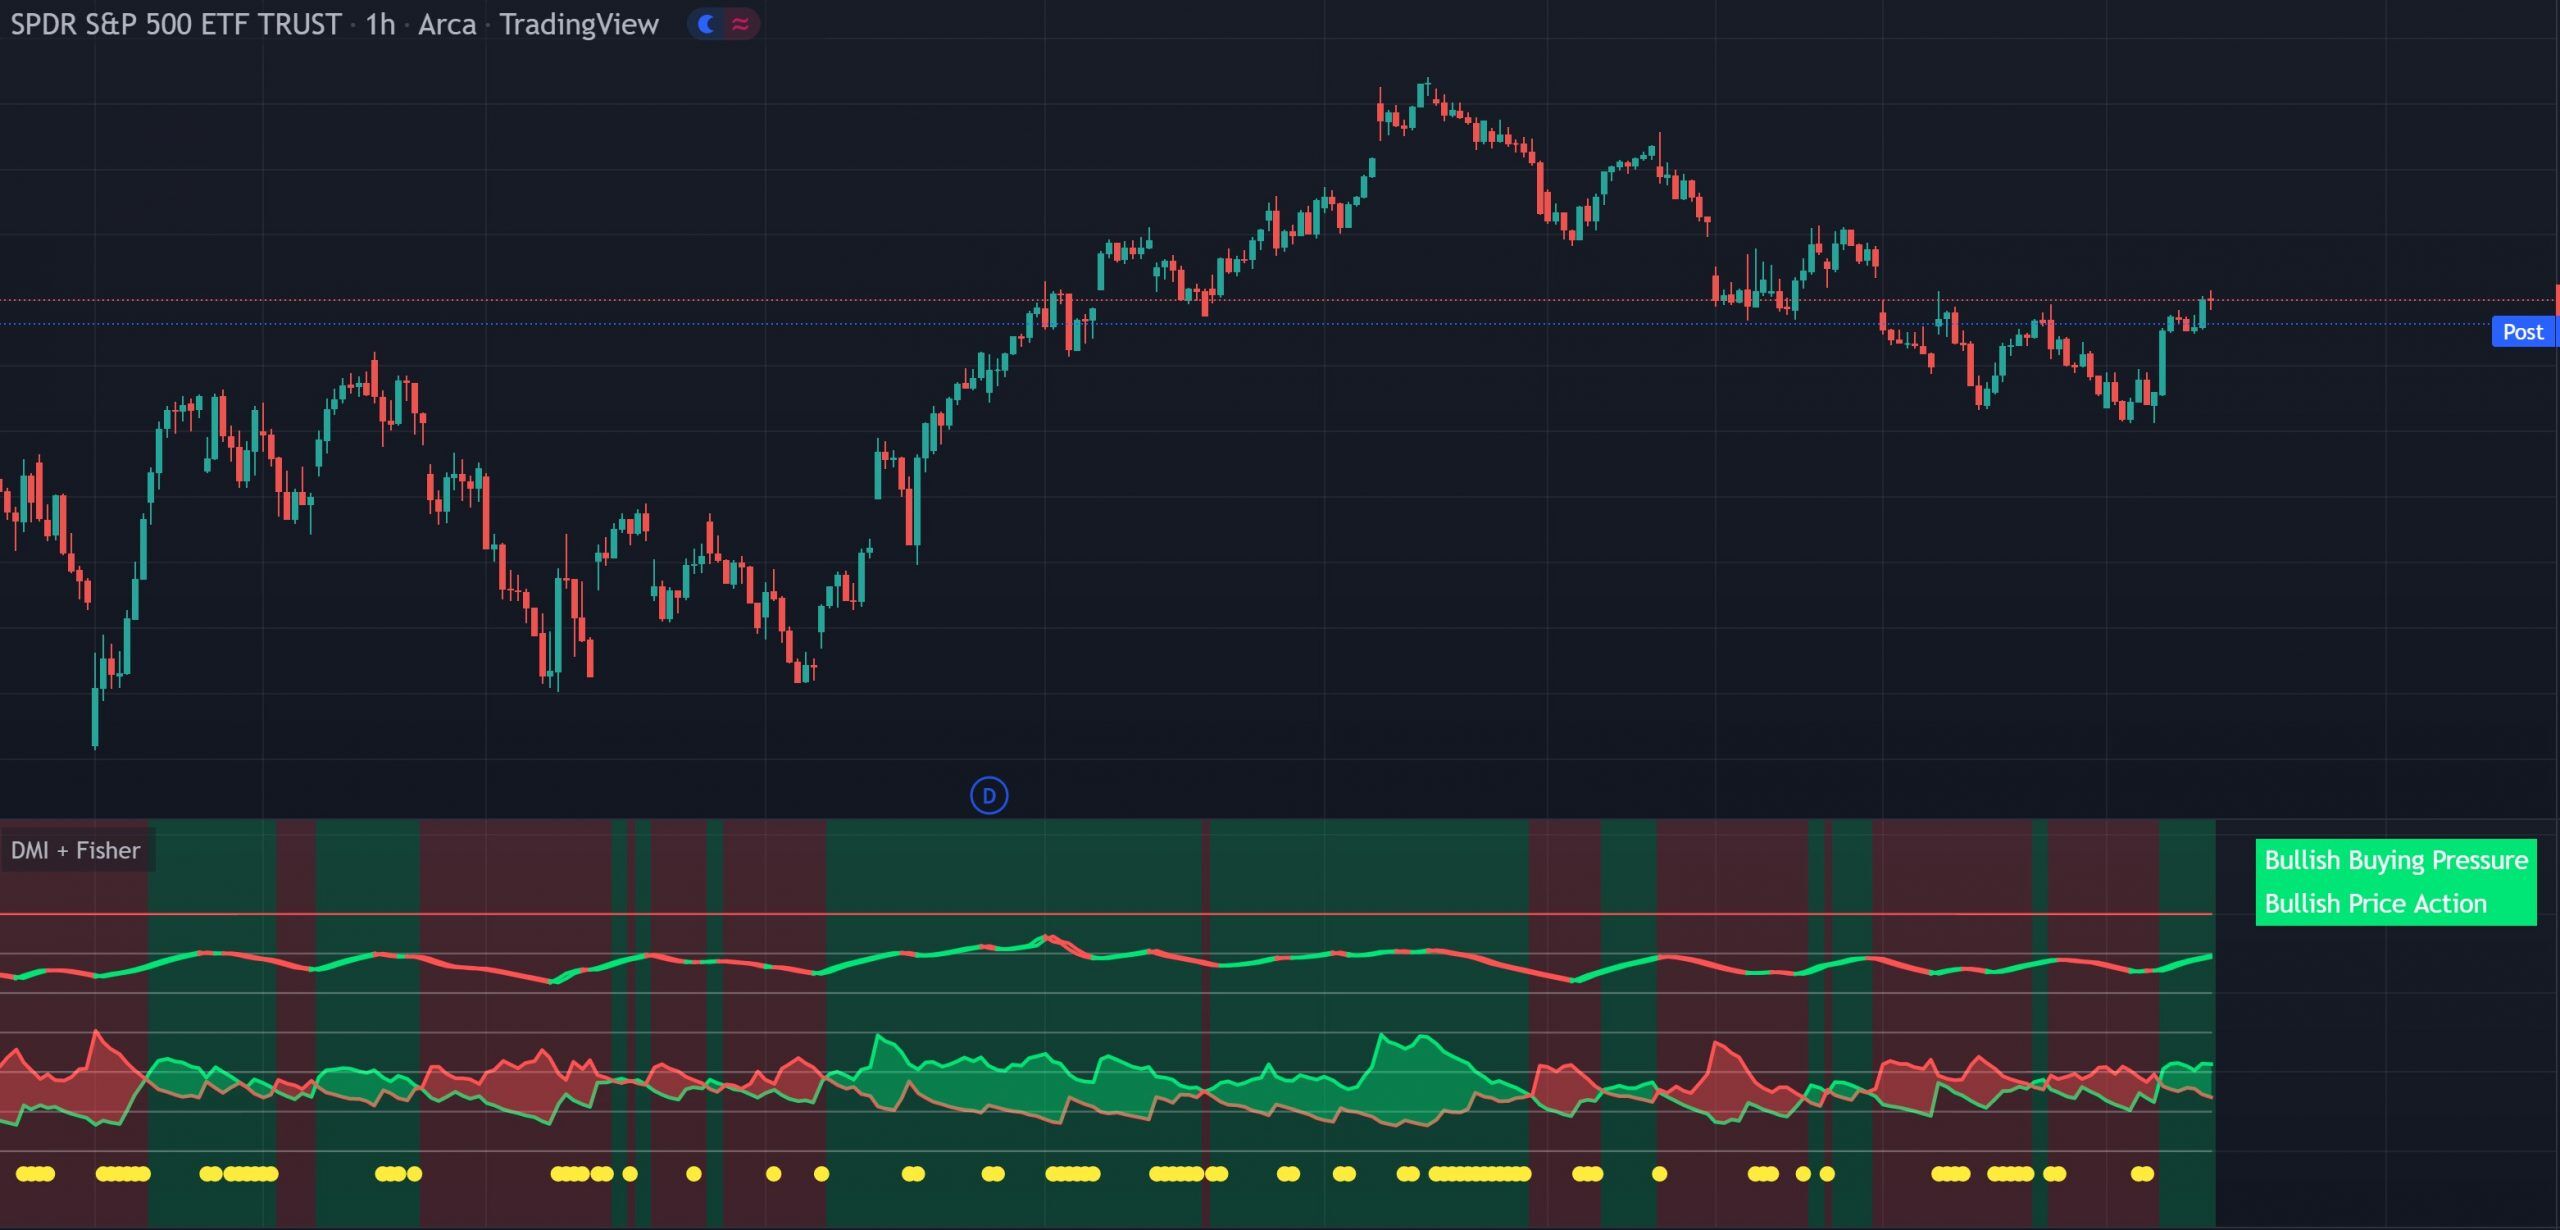
This indicator puts the Directional Movement Index and Fisher Transform into a single pane. The DMI shows buy and sell pressure, the Fisher Transform shows the price action trend, and caution dots warn you when the two disagree. Real-time labels give you an instant read on pressure, trend and signal agreement across any market or timeframe.
What It Does
Two indicators in one pane, DMI buy/sell pressure plus Fisher Transform price action trend, with built-in conflict detection, real-time labels and weak pressure warnings.
The bottom section of the indicator shows the DMI with a color-filled background. When the green line is above the red line and the background is green, there is more market buying than selling. When the red line is above the green line and the background is red, there is more market selling than buying.
The top section shows the Fisher Transform, which tracks the price action trend. When the lines are painted green, price action is trending up. When the lines are painted red, price action is trending down. This gives you a separate read on the directional trend independent of DMI pressure.
Yellow dots appear at the bottom of the indicator when the DMI and Fisher Transform are giving opposite signals. This is a conflict warning, when you see caution dots, the buy/sell pressure and the price action trend disagree, so use caution before entering trades.
A set of labels on the right side updates in real time so you can get a quick interpretation without analyzing the raw data:
The labels can be toggled on or off for better mobile viewing or personal preference.
Interpretation Guide
The strongest signals come when both the DMI and Fisher Transform agree on direction. DMI shows buying pressure and Fisher shows bullish price action (or both bearish). When you see caution dots or the orange conflict label, the indicators disagree and it’s best to wait for alignment before entering. If the purple weak pressure label appears, the directional pressure exists but is weak (DMI below 20), so position sizing and conviction should be adjusted accordingly.
CONFIGURATION
The indicator has a minimal set of options.
| Setting | Default | Description |
|---|---|---|
| Labels On/Off | On | Toggle the real-time bullish/bearish labels on or off. Useful for better viewing on mobile or to reduce visual clutter. |
Good To Know
FREE ON TRADINGVIEW
Add it to your TradingView charts and start reading buy/sell pressure alongside price action trend today. No subscription required.
COMMON QUESTIONS
CHANGELOG
Added the ability to turn the bullish/bearish labels on or off for better viewing on the mobile app or for users who don't want the labels displayed.
EXPLORE MORE
Free
Colors each candle green, red or blue based on DMI pressure. Pairs directly with this indicator. See the DMI pressure data in the pane and the corresponding candle colors on the chart at the same time.
Free
Combines Money Flow Index, RSI and momentum into a single trend label. Use alongside DMI + Fisher to get a second opinion on directional conviction from different momentum indicators.
Free
Multi-indicator trend direction table in one view. Complements DMI + Fisher by showing trend alignment across multiple different indicator types at a glance.