Initial Release
First public release of the MFI + RSI + Momentum indicator with normalized momentum, shared mid line, and real-time bullish/bearish trend labels.
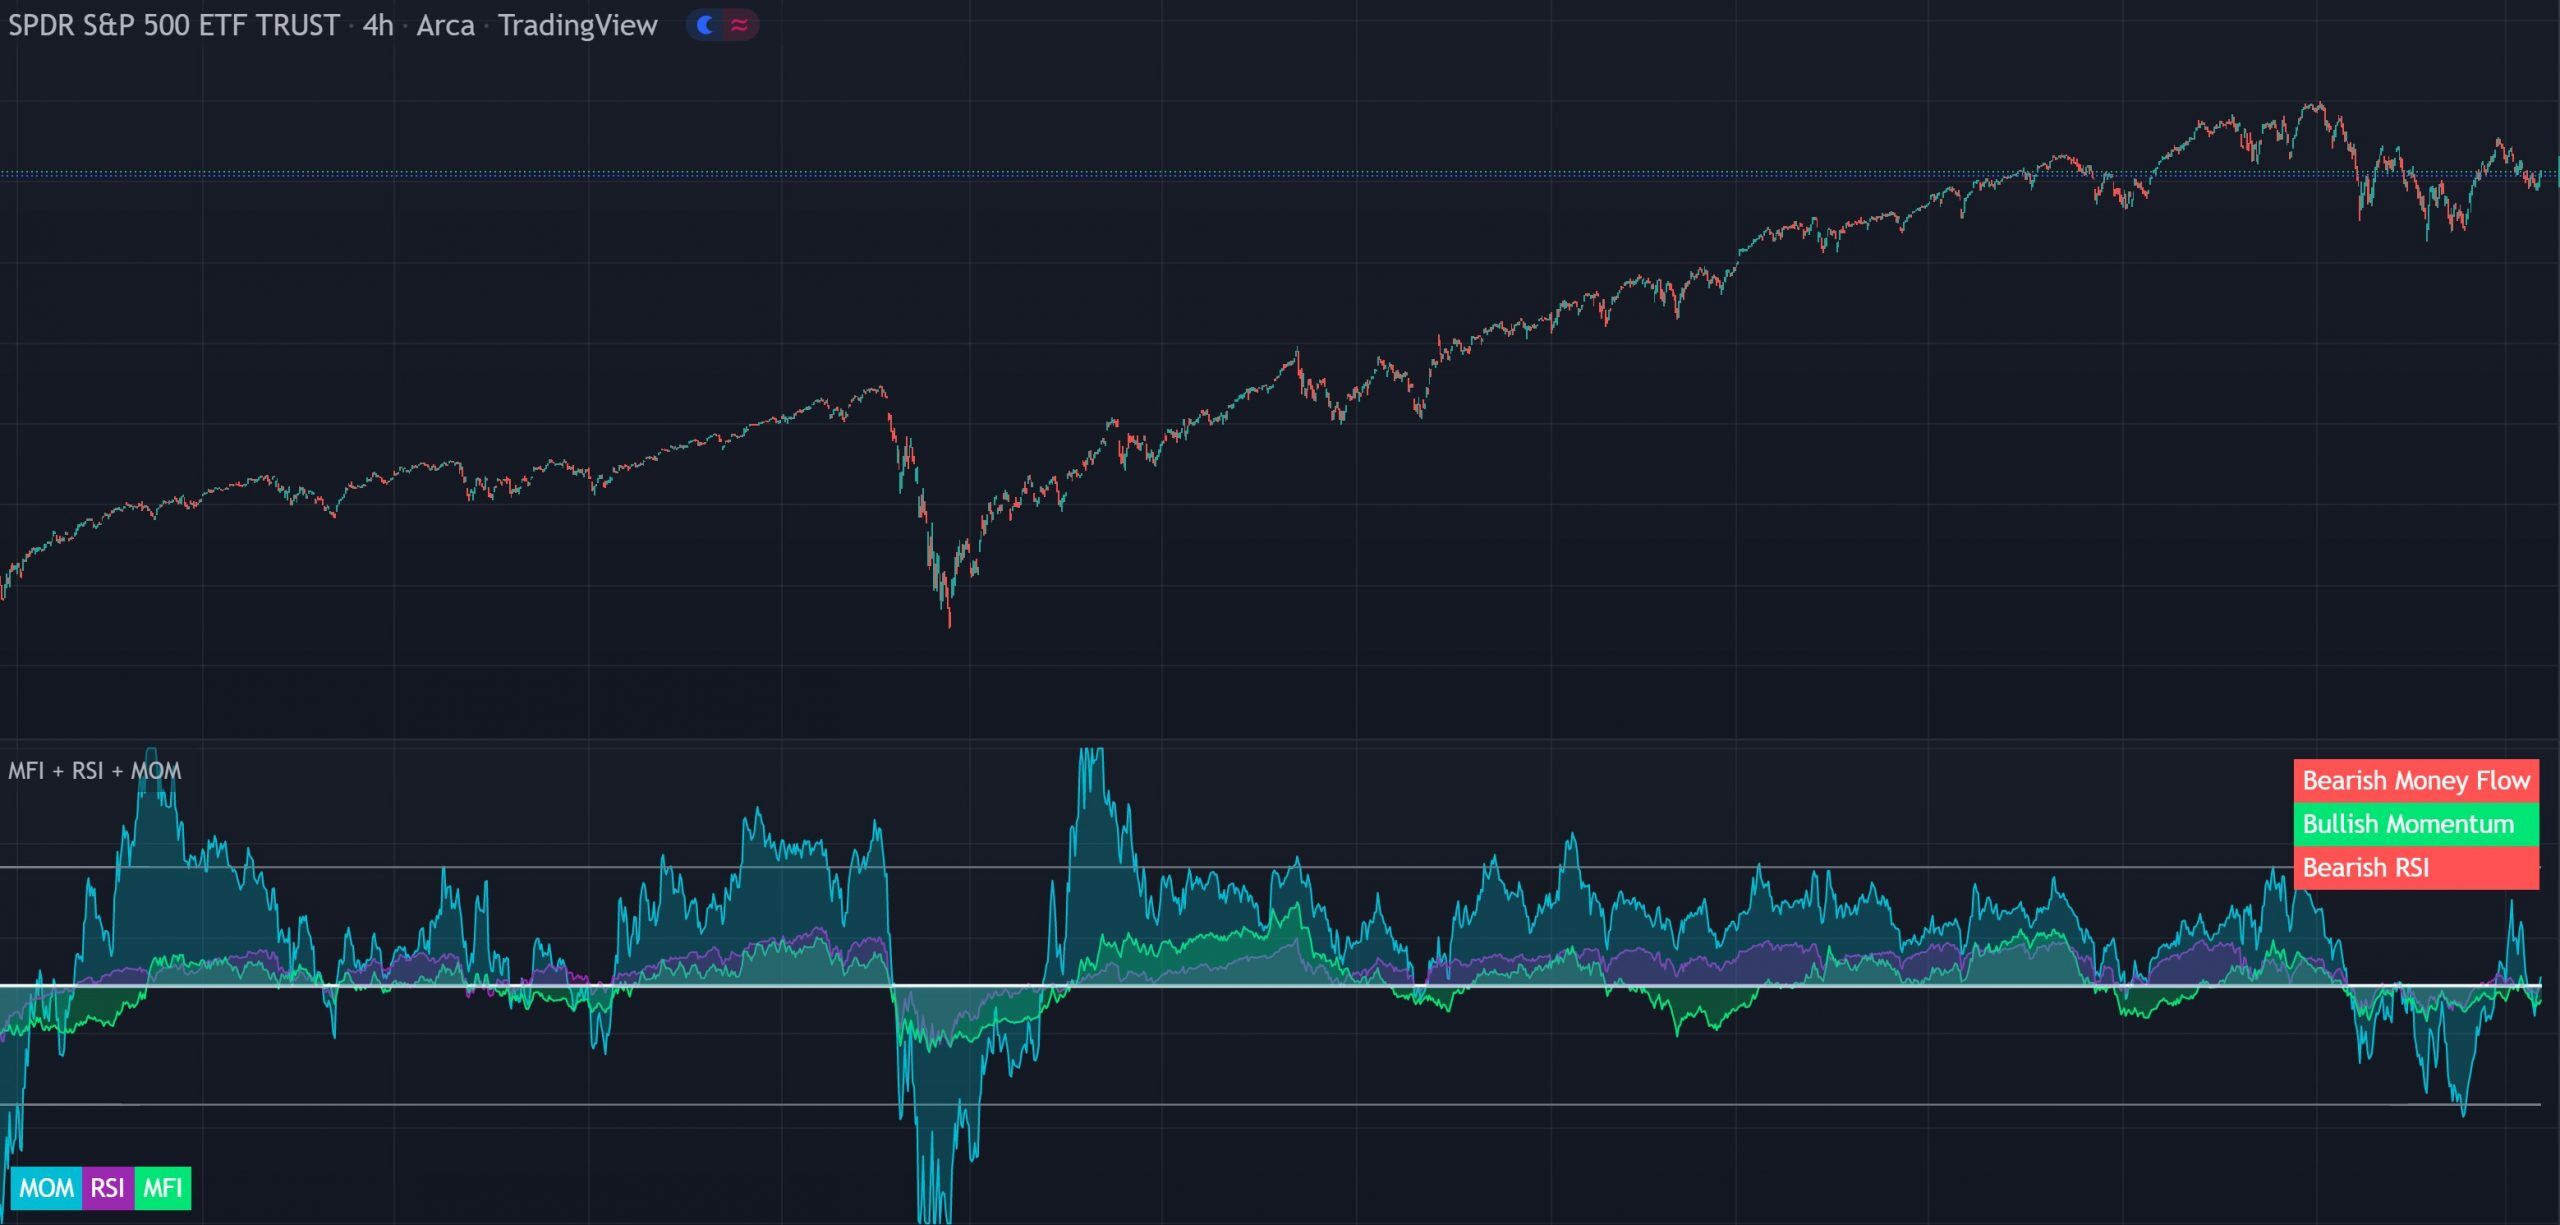
What's Included
• Momentum, MFI and RSI in a single pane with a shared mid line
• Normalized momentum to fit within the 0–100 range
• Real-time color-changing bullish/bearish labels for each indicator
• Customizable lengths, sources and colors