
Default Settings Update & Data Availability Visualization
Updated default settings to show only the most important levels and added a new diagnostic feature to help optimize lower timeframe data settings.
What Changed
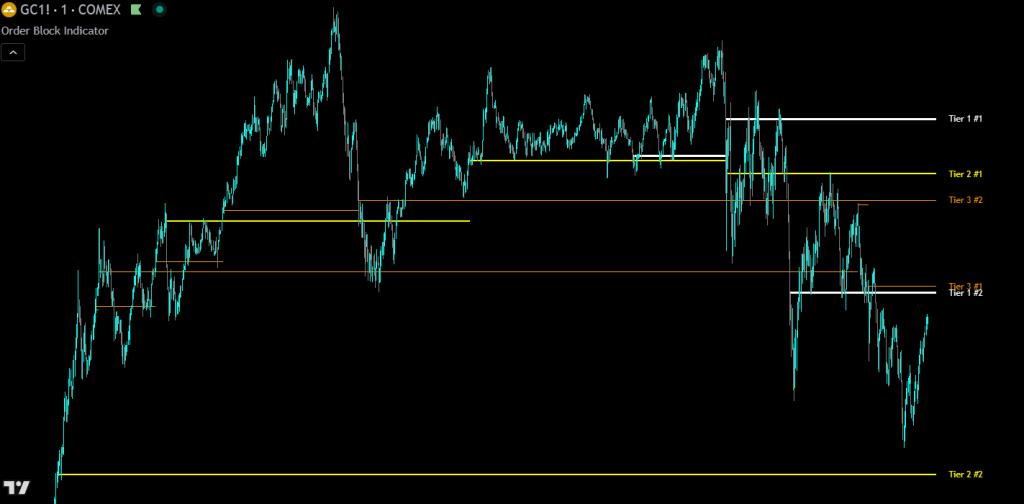
• Default settings updated to show only the most important levels for a cleaner out-of-the-box experience
• New "Show Lower Timeframe History On Chart" feature: Displays colored circles at the bottom of the chart showing where each lower timeframe's data begins, with labels on the first bar of data for each timeframe
• Circle and label colors are adjustable in the Style Settings group