Premium Indicator

Volume Based Auto Support & Resistance for TradingView

Volume Based Auto Support and Resistance indicator on a TradingView chart showing volume spike levels classified by size with a multi-ticker scanner

Volume Based Auto Support & Resistance tracks large market maker orders across multiple timeframes and draws support and resistance levels based on where those orders came in. The indicator uses an adaptive weighted volume tracking system to qualify and classify volume spikes into three tiers: Large, Huge, and Massive, giving you a clear hierarchy of which levels are most likely to produce price reactions.

Each level is labeled with its timeframe and spike classification, and every timeframe can be independently configured to show all qualifying levels or only the most significant ones. A built-in multi-ticker scanner monitors up to 7 additional tickers for both volume spikes and level touches, alerting you when institutional activity or price reactions occur across your watchlist.

Built by Lane Dotson · Last updated · View on TradingView →
Part of the Premium Indicator Suite - 10 indicators for $39.99/mo. View suite → Pricing →

WHAT IT DOES

Core Features

Three-Tier Volume Spike Classification

The indicator uses an adaptive volume tracking system to qualify and classify volume spikes from each higher timeframe bar:

  • Large (L): The lowest qualifying threshold. Draws a standard support or resistance line
  • Huge (H): Larger than the Large category. Indicates significant institutional volume
  • Massive (M): The biggest spikes. Represents the most important levels with the strongest expected price reactions

Each timeframe can be independently configured to show all three levels, only Huge and Massive, or Massive only. For the cleanest charts with only the most significant levels, set all timeframes to Massive only.

Level Labels

Each support or resistance level includes a label showing the timeframe and spike classification. “L” next to the timeframe means Large, “H” means Huge, and “M” means Massive. Labels can be customized: toggle on/off, change text and background color, adjust text size, and control how many bars the labels offset to the right of the current chart bar.

Multi-Timeframe Analysis

The indicator scans multiple higher timeframes for volume spikes. Each timeframe can be independently toggled on or off and configured for which spike sizes to display. Make sure all timeframe settings are higher than your chart timeframe. A warning appears at the top of the chart if any timeframe is set lower than the chart.

Adaptive Level Tracking

Lines track where large market maker orders come in and dynamically adjust as new volume spikes occur. When the lines converge toward the current price (“suck up to price”), it shows where volume is entering the market, typically signaling an imminent reversal or accelerated trend continuation. When all levels converge and change color simultaneously, it indicates market sentiment is shifting and a trend reversal is likely.

Color-Coded Support & Resistance

Lines color green when acting as support and red when acting as resistance. Line and fill colors for support and resistance are independently customizable.

HOW TO TRADE WITH IT

Trading Applications

Trading Bounces at Key Levels

Look for bounces off of Huge and Massive levels. These represent where market makers placed their largest orders and consistently produce strong price reactions. The higher the spike classification, the more significant the expected reaction.

Reading Level Convergence

When the lines converge toward the current price, large orders are coming in at that area. This typically means a reversal is about to happen. If the reversal doesn’t materialize, the trend usually continues in its original direction but moves faster. Wait for levels to converge before trying to buy bottoms or sell tops. This patience keeps you out of choppy price action and gives you entries that move quickly.

Identifying Sentiment Shifts

When all levels converge and all colors change from green to red (or red to green), market sentiment is shifting. This is a strong reversal signal that applies across all timeframes being tracked.

Low Volume Breakout Warning

If price breaks out from the group of levels and no lines converge toward the price, it’s a low-volume breakout. Price usually comes right back to the support and resistance levels in these situations, be cautious.

Higher Timeframe Level Mapping

Look at higher timeframes and draw horizontal lines where the Massive levels extend for a long period. These persist as important levels on lower timeframe charts and give you major zones that price is likely to bounce from.

Exchange Selection for Best Results

Use charts from exchanges with the highest volume and most institutional buyers for better levels: NYSE, ARCA, and NASDAQ for stocks; COINBASE, BINANCE, MEXC perpetual futures, or PEPPERSTONE for crypto.

MULTI-TICKER-MONITORING

Scanner

The built-in scanner monitors up to 7 additional tickers for both volume spikes and level touches. When a volume spike is detected on any enabled timeframe for any enabled scanner ticker, the scanner table shows which ticker and timeframe produced the spike. When a chart timeframe candle touches a support or resistance level on any scanned ticker, the scanner shows which level is being touched.

The scanner can be configured to show volume spikes only, level touches only, or both. This setting also affects which alerts fire. Each scanner ticker can be independently toggled on or off.

Customize the scanner table position, text and background colors, and the number of candles that each scanner alert persists for.

CONFIGURATION

Settings Overview

Timeframe Settings

Setting Default Description
Timeframe On/Off Varies Toggle each timeframe on or off. Affects both chart levels and scanner results
Spike Level Filter All Per timeframe: show Large + Huge + Massive, Huge + Massive only, or Massive only. Massive gives the cleanest charts with the most important levels
Higher Timeframe Selection Varies Select which higher timeframes to scan. Default optimized for 1-minute charts. Update when using higher chart timeframes

Scanner Settings

Setting Default Description
Scanner On/Off On Toggle the entire scanner table
Scanner Display Mode Both Show volume spikes only, level touches only, or both. Also affects which alerts fire
Scanner Tickers (1–7) Varies Up to 7 tickers, each independently toggleable. Input tickers from a sector to monitor the sector as a whole
Alert Candle Duration 3 Number of candles each scanner alert stays visible in the table
Table Position / Colors / Text Size Varies Customize scanner table position, text color, and background color

Label Settings

  • Toggle labels on or off
  • Customize text color, background color, and text size
  • Adjust label offset (number of bars to the right of current chart bar)

Line & Color Fill Settings

  • Customize support and resistance line colors independently
  • Customize support and resistance fill colors independently

STAY NOTIFIED

Alerts

Available alert conditions:

  • Volume Spike Detected – Chart Ticker: Fires when a volume spike is detected on any enabled timeframe for the chart ticker
  • Volume Spike Detected – Scanner Ticker: Fires when a volume spike is detected on any enabled timeframe for any enabled scanner ticker
  • S&R Level Touch – Chart Ticker: Fires when a support or resistance level is touched on any enabled timeframe for the chart ticker
  • S&R Level Touch – Scanner Ticker: Fires when a support or resistance level is touched on any enabled timeframe for any enabled scanner ticker

The scanner display mode setting (volume spikes only, level touches only, or both) also controls which alert types are active.

MARKETS & TIMEFRAMES

Compatibility

The indicator works on all markets with volume data including stocks, crypto, futures, and forex. It can be used on any timeframe as long as there is enough data for the session used. The default higher timeframe settings are optimized for the 1-minute chart. Update them when using higher chart timeframes.

For best results, use charts from exchanges with the highest volume and most institutional participation.

GOOD TO KNOW

Important Notes & Limitations

All timeframe settings must be higher than your chart timeframe. A warning appears at the top of the chart if any timeframe is set lower. Update your higher timeframe settings when switching chart timeframes.
Default settings are optimized for the 1-minute chart. Create separate chart layouts for each timeframe you use frequently and save your settings on each to avoid reconfiguring.
Scanner is limited to 7 tickers due to TradingView's request.security() call limits.
Volume data quality affects level accuracy. Use exchanges with the highest volume and most institutional buyers for the best levels. NYSE, ARCA, NASDAQ for stocks; COINBASE, BINANCE for crypto.
If there are no levels near the current price, previous levels in that price range are still relevant. Look left on the chart for historical levels.

POWER USER TIPS

Tips & Pairings

GET ACCESS

Get Volume Based Auto S&R
Plus 9 More Premium Indicators

Access the full Premium Indicator Suite on your TradingView charts. All 10 indicators, chart templates, and priority support.

$39.99/month · Cancel anytime · Try it: $24.99 for 2 weeks
10 Premium Indicators
Chart Templates
All Future Updates
Priority Support

COMMON QUESTIONS

Frequently Asked Questions

The indicator classifies volume spikes into three tiers using an adaptive volume tracking system. Large is the lowest qualifying threshold. Huge represents significantly bigger volume than Large. Massive represents the biggest spikes. The most important levels with the strongest expected price reactions. Each timeframe can be configured to show all three levels, only Huge and Massive, or only Massive for the cleanest chart.
When the support and resistance lines converge toward the current price, it means large volume is entering the market at that area. This typically signals an imminent reversal or accelerated trend continuation. Wait for the lines to converge before trying to buy bottoms or sell tops. This patience keeps you out of choppy price action and gives you entries that move quickly. When all levels converge and change color simultaneously, market sentiment is shifting.
Each level has a label showing the timeframe and spike classification. "L" means Large, "H" means Huge, and "M" means Massive. For example, "4H M" means a Massive volume spike on the 4-hour timeframe, one of the most significant levels on the chart. Use the labels to quickly identify which levels deserve the most attention.
The scanner monitors all enabled tickers for price touching any of their support and resistance levels on any enabled timeframe. When a chart timeframe candle touches a level on a scanned ticker, the scanner table shows which ticker and which level is being touched. This is useful for spotting when correlated markets are reacting to institutional volume levels simultaneously, providing extra confluence for your trade decisions.
Volume Based Auto S&R focuses exclusively on volume spike detection with a three-tier classification system and real-time level tracking that shows where market maker orders are actively coming in. Supply and Demand uses four types of levels: volume spikes, higher timeframe OHLC candles, trading sessions, and VWAP for a broader view of reversal zones. They complement each other well when both flag the same price area.

CHANGELOG

Release Notes

Pine Script v6 Upgrade, Three-Tier Classification & Scanner Overhaul

Major overhaul upgrading to Pine Script v6 with a completely new adaptive volume spike classification system, per-timeframe and per-ticker controls, scanner level touch detection, labels on every level, and 4 new alert types.

What Changed
Updated to Pine Script v6
New adaptive weighted volume tracking system. Volume spikes classified as Large, Huge, or Massive
Each timeframe can filter by all levels, Huge + Massive only, or Massive only
Per-timeframe on/off toggles. Affects both chart levels and scanner
Per-ticker on/off toggles for scanner (reduced from 8 to 7 tickers due to TradingView limits)
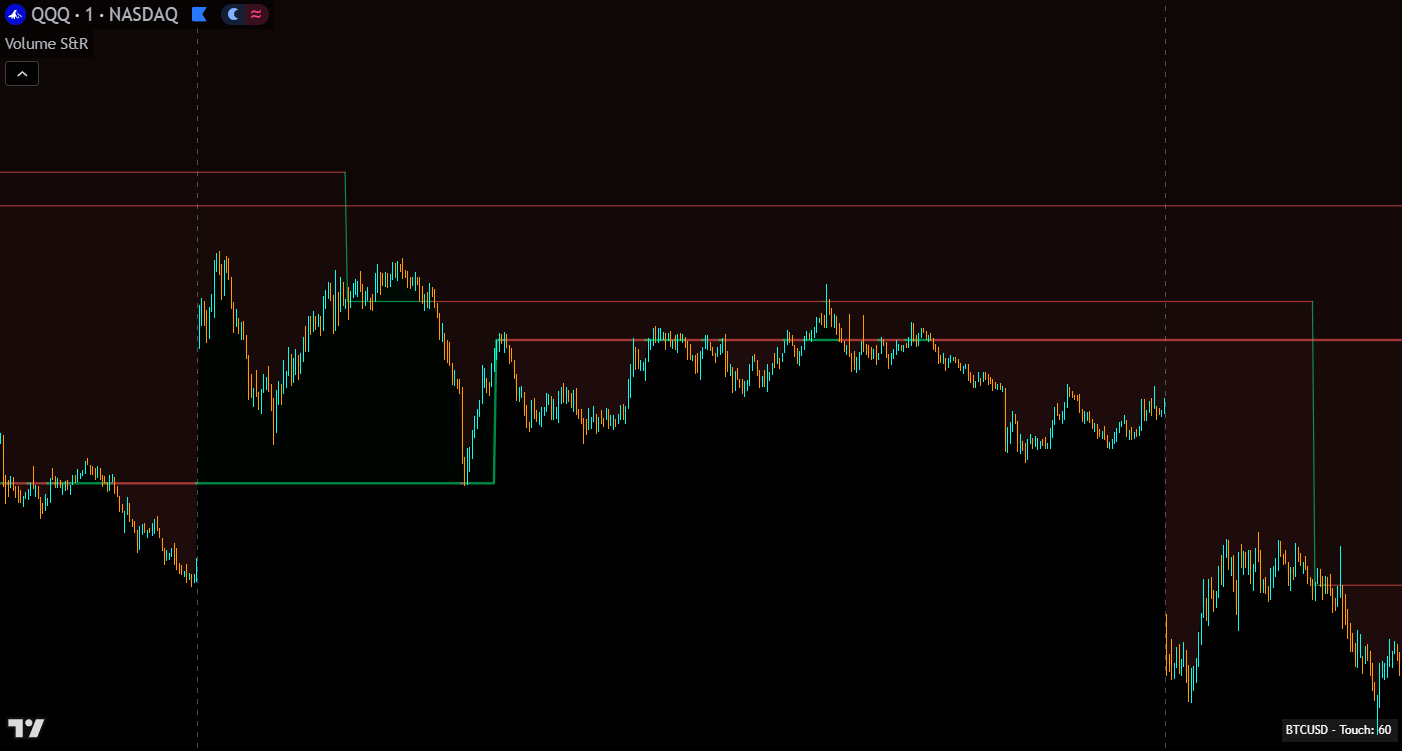
Scanner level touch detection. Shows when price touches S&R levels on scanned tickers
Scanner display mode: volume spikes only, level touches only, or both (also affects alerts)
Labels added to each level showing timeframe and spike classification (L/H/M)
4 new alerts: Volume Spike Detected (chart/scanner) and S&R Level Touch (chart/scanner)
Line and color fill customization for support and resistance
Timeframe warning when a setting is lower than the chart timeframe

EXPLORE THE SUITE

Related Indicators

Premium Suite

Uses four types of levels: volume spikes, OHLC candles, trading sessions, and VWAP for a broader view of reversal zones. Complement Volume Based Auto S&R with session and OHLC levels that this indicator doesn’t cover.

Premium Suite

Generates buy and sell signal arrows across three trading modes. Take signal entries at volume-validated S&R levels for the highest probability trades with clear stop loss placement at the level boundary.

Premium Suite

A smoothed 6-oscillator trend strength indicator with momentum confirmation. Use the ribbon to confirm direction when price reaches volume-based S&R levels for added confluence before entering.