Free Indicator

Higher Timeframe Candle Levels Indicator for TradingView

Higher Timeframe Candle Levels indicator showing multi-timeframe support and resistance levels with trend candle coloring and trend strength scoring table on a TradingView chart

Higher Timeframe Candle Levels is a free TradingView indicator that plots seven higher timeframe candle structures(from 1 hour to yearly) directly on your chart as support and resistance. It includes trend candle coloring, a trend strength scoring table, a trailing stop loss, level labels and alerts for traders who want multi-timeframe context on any market.

Built by Lane Dotson · Last updated · View on TradingView →
This is a free indicator - Add it to your TradingView charts at no cost.
Add to TradingView →

WHAT IT DOES

Core Features

The indicator maps higher timeframe candle structures onto your chart as support and resistance, with trend scoring, candle coloring, a trailing stop loss and full alerts.

Multi-Timeframe Candle Levels

The indicator plots 6 levels per candle for each timeframe: current candle open, previous open, previous high, previous low, previous close and previous candle body midline. Timeframes available are 1 hour, 4 hour, daily, weekly, monthly, quarterly and yearly. Each level paints green for an up candle or red for a down candle, with midlines and current open in a distinct color for easy differentiation. You can control how many previous candles display per timeframe and extend daily-and-above levels to the right when price is breaking beyond all visible levels.

Trend Candle Coloring

This feature paints your chart candles based on whether the current close is above or below a higher timeframe candle’s midline, candle body or high/low, your choice. An up color shows when price is above the selected reference, a down color when below, and a neutral color when inside. For example, with “candle body” selected, candles paint the up color when price closes above the body top, down when below the body bottom, and neutral when inside helping you trade breakout momentum from the higher timeframe candle structure. Make sure to turn off default candle colors in chart settings for this to display properly.

Trend Strength Scoring Table

A table at the bottom of the screen shows a trend strength score for each higher timeframe. If price is above the midline, its strength is 1. Above the candle body, 2. Above the high, 3. The same logic applies in reverse for bearish scores of -1, -2 and -3. A total score on the far right adds all timeframe scores together. Each timeframe scores up to ±3. Wait for a high total score relative to the number of enabled timeframes before trading to ensure you’re trading with the strongest multi-timeframe alignment.

Trailing Stop Loss

A stop loss feature follows the most recent higher timeframe candle’s trend using the candle body, high/low or midline. Your choice of reference and direction (long or short). When a new higher timeframe candle forms, the stop loss updates automatically to the new level. In long mode with “candle body” selected, it uses the lowest body level of the previous candle (open for up candles, close for down candles). A historical line shows where the stop was set previously. The high/low setting is recommended, especially when the market starts trending.

Level Identification Labels

Labels identify each level starting from the 4-hour timeframe and above so you can tell exactly what level you’re looking at even when the rest of the candle is off-screen. Label colors match the candle direction, label positioning is adjustable, and each timeframe’s labels can be toggled independently. 1-hour labels are excluded to avoid chart clutter.

Alerts

The indicator includes trend change alerts based on your Trend Candle Coloring settings. The Trend Candle Coloring feature must be turned on when creating these alerts. It also has level touch alerts for open/close, high/low, midline or any level per timeframe, so you get notified when price reaches a higher timeframe level on any of your favorite tickers.

INTERPRETATION GUIDE

How to Trade With the Levels

Trend Direction From Candle Position

Level Bounces & Breakouts

The highs and lows of daily-and-above levels are excellent reversal zones. Watch for price to struggle at these levels and trade the reversal, or if price breaks through easily, watch for a retest and trade the continuation. The open, close and midline levels are strong bounce zones. Watch for wicks beyond these levels with closes back on the other side as confirmation of a bounce.

Designed to Work With

Higher Timeframe Candle Levels, Trend Strength and Breakout Scanner all use the same levels and calculate trend scores the same way. Use Trend Strength to see historic and current trend direction visually. Use the Breakout Scanner to find which markets are trending strongest across multiple tickers. All three are designed to work together.

CONFIGURATION

Settings Overview

The indicator is fully customizable. Each timeframe, level type, visual element and alert can be independently toggled. Here are the key settings.

Main Settings

Setting Default Description
Timeframes (1H–1Y) All On Toggle each of the 7 timeframes on or off. Each has individual controls for all 6 level types.
Number of Previous Candles Varies How many previous candles to display per timeframe. Default settings stay under 500 total lines. Each candle uses 6 lines if all levels are on.
Extend Levels Right Off Extend daily-and-above levels to the right for visibility when price breaks beyond all plotted levels.
Trend Candle Coloring Off Paint chart candles based on position relative to a higher timeframe's midline, candle body or high/low. Must be on when creating trend change alerts.
Trend Strength Table On Toggle the scoring table on or off. Table position is customizable. Each timeframe in the table can be individually toggled.
Stop Loss Off Enable trailing stop loss based on a selected timeframe, direction (long/short) and reference level (candle body, high/low, midline).
Labels On (4H+) Toggle level identification labels per timeframe. Offset adjustable to avoid overlapping price action. Available from 4H and above.
Candle Body Coloring Varies Toggle the background fill between candle body levels on or off. Customize the fill color.
Line Colors Green / Red Customize the up candle, down candle, midline and current open line colors.

GOOD TO KNOW

Important Notes & Limitations

TradingView limits the number of lines to 500 per indicator. Each candle uses up to 6 lines if all levels are on. The default settings stay under 500, but increasing the number of previous candles may exceed this limit. A notification will appear if you go over. Reduce the number of levels for timeframes not visible on your chart.
Longer timeframe levels (quarterly, yearly) may not display if the start of that candle is beyond your TradingView plan's historical bar limit. A notification will tell you to lower the display count for that timeframe.
Trend Candle Coloring must be turned on when creating trend change alerts. If it is off at the time of alert creation, the alerts will not fire.
Turn off candle coloring on other indicators and in your chart settings for the Trend Candle Coloring feature to display properly.

FREE ON TRADINGVIEW

Higher Timeframe Candle Levels is Free to Use

Add it to your TradingView charts and start trading with multi-timeframe support and resistance levels today. No subscription required.

100% Free
No Account Required
All Future Updates

COMMON QUESTIONS

Frequently Asked Questions

Each timeframe plots up to 6 levels: current candle open, previous open, previous high, previous low, previous close and the previous candle body midline. Each level and timeframe can be individually toggled on or off.
Each timeframe gets a score from -3 to 3 based on where price is relative to the candle structure. Above the midline = 1, above the body = 2, above the high = 3. Same in reverse for bearish. A total score adds all timeframe scores together. Trade when the total is high relative to the number of enabled timeframes.
Choose a timeframe, direction (long or short) and reference level (candle body, high/low, midline). The stop follows the most recent higher timeframe candle's level and updates automatically when a new candle forms. A historical line shows where the stop was previously.
TradingView limits indicators to 500 lines. Each candle uses up to 6 lines when all levels are on. Reduce the number of previous candles displayed for timeframes that aren't visible on your current chart until the notification goes away.
This indicator is designed to work with Trend Strength and Breakout Scanner. All three use the same levels and scoring system. Use Trend Strength for historical trend visualization and the Breakout Scanner to find the strongest trending tickers across multiple markets.

CHANGELOG

Release Notes

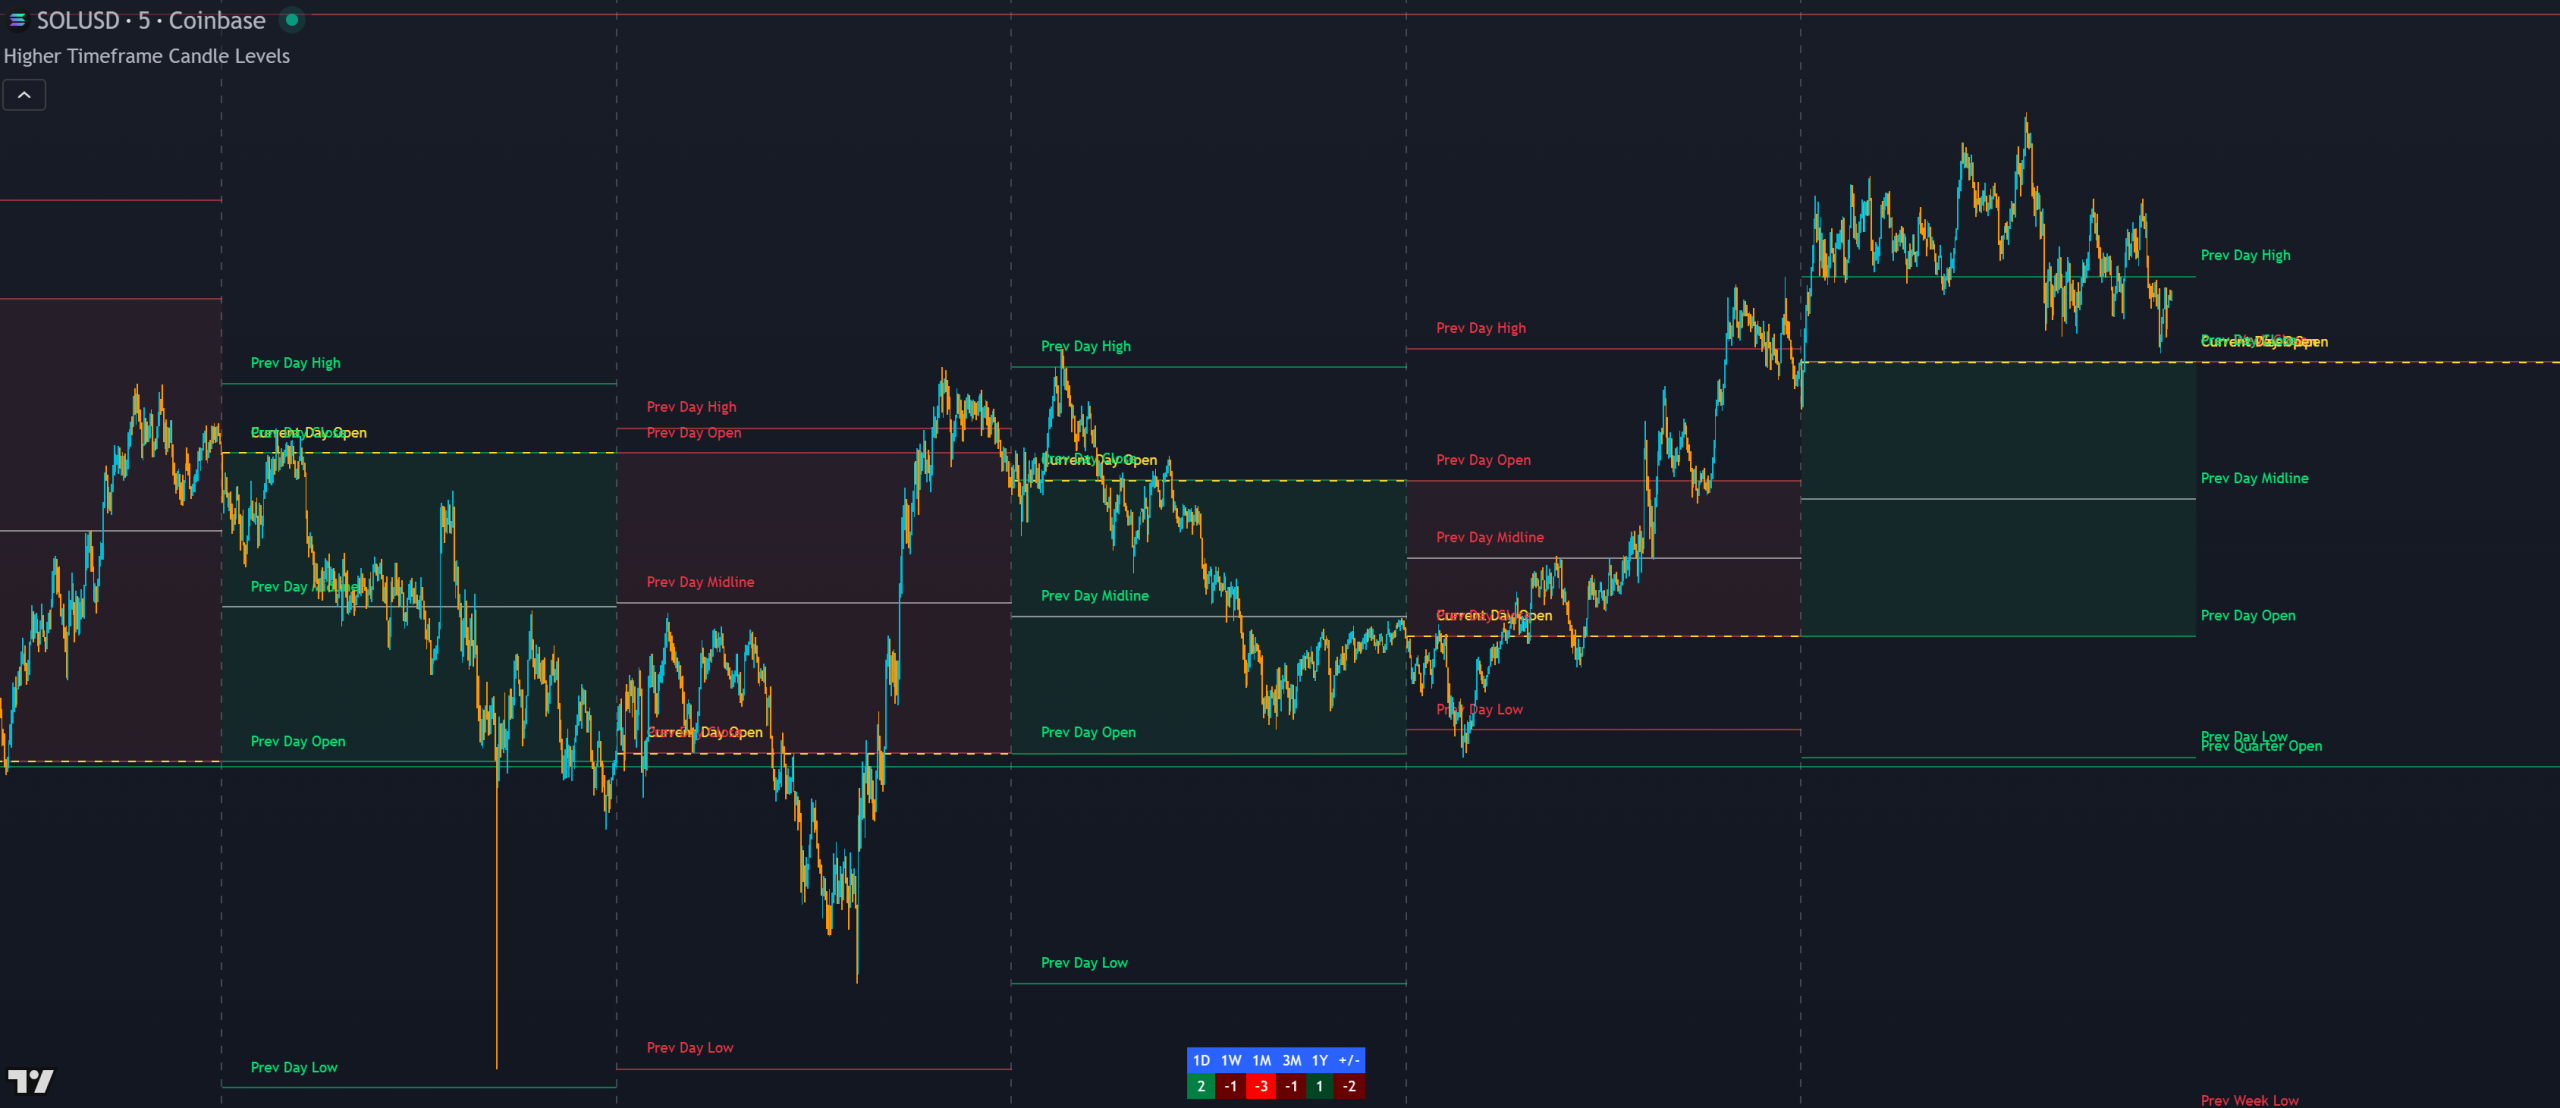
Compatibility Update for All TradingView Plans

Restructured the request.security calls to use a more efficient structure that stays under TradingView's 40 unique call limit, making the indicator compatible with all subscription tiers.

What Changed
Optimized request.security calls so users of all TradingView subscription tiers can use the indicator
Show older updates
Initial Release

First public release of Higher Timeframe Candle Levels with 7 timeframes, trend candle coloring, trend strength scoring table, trailing stop loss, level labels and alerts.

What's Included
Candle levels from 1H, 4H, daily, weekly, monthly, quarterly and yearly timeframes
6 levels per candle: current open, previous open, high, low, close and midline
Trend candle coloring based on higher timeframe candle position
Trend strength scoring table with per-timeframe scores and total
Trailing stop loss with configurable timeframe, direction and reference level
Alerts for trend changes and level touches per timeframe

EXPLORE MORE

Related Indicators

Free

Multi-ticker breakout scanner scoring trend strength across 4 higher timeframes. Uses the same levels and scoring system is designed to work together to identify the strongest trending markets.

Free

Visualizes historic and current trend strength relative to higher timeframe candle levels. The third piece of the trio. Use it to see how the trend has developed over time on your chart.

Free

Auto fibonacci retracement and extension levels from the previous high and low. Layer with higher timeframe candle levels to see where fibonacci zones and candle structure support/resistance overlap.