The Supply and Demand indicator is a major institutional-level tool for day and swing traders on TradingView. It draws price-reaction zones across seven timeframes using four types of levels: adaptive volume spikes, higher timeframe OHLC candles, Tokyo/London/New York session boxes, and two independent VWAPs, each with its own reset timeframe and previous-close lines.
Each timeframe offers two distinct 50% midlines (candle body and full range), current open lines for live intraday bias, and price-tracking labels for instant identification. The indicator also outputs an external trend direction value that other indicators can read for signal filtering. All levels are fully customizable with per-timeframe toggles, extend-right options, and a reorganized settings panel.
Part of the Premium Indicator Suite - 10 indicators for $39.99/mo.
View suite →Pricing →
What It Does
Core Features
The indicator draws institutional price levels across seven timeframes using four types of zones, two distinct midline types, current open lines, and an external trend direction output.
Volume Spikes
The indicator uses an adaptive weighted volume spike detection system that automatically calibrates to recent market conditions. Instead of a static lookback, the system filters out outliers and adapts to changes in volume trends for more accurate level placement. Volume spike calculations are available across your configured timeframes and each is color-coded for easy identification.
Volume spike levels across multiple timeframes color-coded with thicker lines for weekly and monthly levels.
Current Open Lines
A dashed line marks the open price of the in-progress candle on every timeframe. Available on 1H, 4H, 1D, 1W, 1M, 3M, and 1Y. These serve as a live intraday or longer-term bias reference: bullish when price is above the open, bearish when below.
OHLC Higher Timeframe Candles
The indicator plots the high, low, open, and close of the most recent closed candle from each higher timeframe. You can adjust how many previous candles to display. Higher timeframes available: 1-hour, 4-hour, daily, weekly, monthly, quarterly, and yearly. Each timeframe can be independently toggled on or off.
You can choose to show only high & low lines, only open & close lines, only midlines, or all of them, giving you full control over which levels appear on your chart. Daily, weekly, monthly, quarterly, and yearly timeframes each have an option to extend lines to the right edge of the chart instead of stopping at the next period boundary.
Note: The 3-day OHLC levels have been removed.
Higher timeframe OHLC levels. Thicker lines for monthly, quarterly, and yearly levels.
50% Midlines
Each higher timeframe now offers two distinct midline types that can be independently toggled per timeframe:
CB 50% Midline: The midpoint of the previous candle’s body (open-to-close, wicks excluded). This marks where the candle’s actual traded range centered.
HL 50% Midline: The midpoint of the full range (high-to-low, wicks included). This marks the true center of the candle’s total price movement.
Both midline types act as dynamic trend direction support and resistance. When price is above the midline for a given timeframe, that timeframe is bullish until price holds below it. The opposite is true for bearish conditions.
Use the 1-hour and 4-hour midlines as short-term trend direction guides and the daily, weekly, monthly, and higher midlines as longer-term targets and direction. Price tends to bounce between higher timeframe midlines almost like a magnet, so pay close attention to these levels.
Trading Sessions
Trading session levels are important because market makers in different parts of the world typically position themselves at these specific times. Tokyo, London, and New York sessions are rendered as session boxes and now trigger from each market’s local timezone. Tokyo always fires at 09:00 JST, London at 08:00 BST/GMT, and New York at 09:30 ET, regardless of daylight saving differences between regions.
Sessions and VWAPs only display on intraday charts. They hide automatically on daily charts and higher.
Note: Session premarket boxes have been removed.
Tokyo, London, and New York session levels. Premarket open, regular open, close, and high/low.
VWAP & Previous Session Close
The indicator now includes two fully independent VWAPs, each with its own reset timeframe (4H, 12H, 1D, 1W, 1M, 3M, or 12M), thickness setting, and previous-close lines. This replaces the single VWAP from previous versions.
VWAPs are extremely important levels. Market makers hedge positions based on them and you will typically see strong reactions, especially in the first hour of market open. Having two VWAPs with different reset periods lets you track both short-term and long-term institutional positioning simultaneously.
Sessions and VWAPs only display on intraday charts. They hide automatically on daily charts and higher.
Live VWAP and previous session VWAP close levels. Market makers hedge positions around these levels.
Price-Tracking Labels & Warning Table
Every level type can show a price-tracking label that follows the right edge of the chart, letting you identify lines at a glance without needing a color-coded reference table. Label text color, background color, and size are all customizable.
A warning table in the top-center of the chart alerts you if a Display Anchor needs to be lowered or if you have more than 500 lines turned on (TradingView’s hard cap). Default settings produce roughly 265 lines, well under the cap.
Note: The old line identification and session identification tables have been removed and replaced by this new label and warning system.
External Trend Direction Output
The indicator outputs a trend direction value (1 for bullish, -1 for bearish, 0 for neutral) that other Trend Friend indicators can read via their external filter source. Configure up to four filters: two VWAPs and two OHLC levels. The output only flips bullish or bearish when every enabled filter agrees.
The default settings are designed for scalping the 1–5 minute charts. Wait for price to react from supply and demand levels by showing wicks, struggling to break through, or printing reversal candles. Ride those moves to the next major supply and demand area before taking profit. You may want to turn on sessions and some of the lower timeframe levels if there are big gaps on the chart that are not suitable for scalping.
For the best scalping setup, use the Buy Sell Indicator alongside Supply and Demand. Wait for a signal to come in at or near the supply and demand levels, scalp or swing the reversals to the next zone, and repeat.
Swing Trading
Turn off the lower timeframe and session levels. Leave only higher timeframe OHLC lines, midlines, and volume spike levels. Swing trades that reverse off of these levels to the next major zone.
Using 50% Midlines for Trend Direction
When price is above the midline for each timeframe, that timeframe is bullish. When below, bearish. Use the 1-hour and 4-hour midlines as short-term trend direction and the daily, weekly, monthly midlines as longer-term targets. When short-term midlines disagree with long-term midlines, look for the short-term trend to revert toward the longer-term direction.
Price bounces between higher timeframe midlines like a magnet. Use these as profit targets and trend direction confirmation.
CONFIGURATION
Settings Overview
The indicator is fully customizable with a reorganized settings panel. All color inputs have been consolidated into four groups at the bottom of the panel (OHLC, Volume Spike, Session, VWAP). Day-to-day toggles live in the upper sections. Comprehensive tooltips have been added to every input.
Level Type Toggles
For each higher timeframe, you can choose to display:
High & Low lines only
Open & Close lines only
50% Midlines only
All of the above
This gives you full control over chart clutter. For best results, use high & low plus midlines for each timeframe.
Volume Spike Settings
Current chart timeframe, 1H, 4H, daily, weekly, and monthly volume spike levels
Each independently toggleable with adjustable lookback lengths
Color-coded per timeframe
OHLC Higher Timeframe Settings
1H, 4H, daily, weekly, monthly, quarterly, and yearly (3-day removed)
Adjustable number of previous candles per timeframe
Each independently toggleable
Two midline types per timeframe: CB 50% and HL 50%, each independently toggleable
Current open lines per timeframe
Extend lines right option for daily, weekly, monthly, quarterly, and yearly
Display Anchor setting for weekly, monthly, quarterly, and yearly — choose a lower timeframe as the drawing trigger so higher timeframe levels load correctly on intraday charts
Trading Session Settings
Tokyo, London, and New York session boxes
Sessions trigger from each market’s local timezone
Adjustable number of session boxes
Individual toggles for regular session open, close, and high/low per session
Sessions only display on intraday charts
Note: Premarket boxes removed.
VWAP Settings
Two independent VWAPs (#1 and #2)
Each has its own reset timeframe: 4H, 12H, 1D, 1W, 1M, 3M, or 12M
Adjustable thickness per VWAP
Previous session close lines per VWAP
VWAPs only display on intraday charts
Midline Settings
Two midline types per timeframe: CB 50% (candle body midpoint) and HL 50% (high-to-low midpoint)
Each independently toggleable per timeframe
Customizable colors
Labels & Warning Table
Price-tracking labels per level type: toggle on/off, customize text color, background color, text size, and right offset
Warning table in top-center: alerts for Display Anchor issues and line count exceeding 500
External Trend Output Settings
Configure up to 4 filters: two VWAPs and two OHLC levels
Output flips to 1 (bullish) or -1 (bearish) only when all enabled filters agree
0 (neutral) when filters disagree
Markets & Timeframes
Compatibility
The Supply and Demand indicator can be used on any market with price data including stocks, crypto, forex, and futures. It works on any timeframe from the second charts all the way up to the yearly charts.
The default settings are optimized for 1–5 minute chart scalping. If you are using higher timeframes, turn off lower timeframe levels to reduce chart clutter. Sessions and VWAPs only display on intraday charts and hide automatically on daily and higher. If higher timeframe levels do not appear correctly, check the warning table. It will tell you which Display Anchor needs to be lowered. On intraday charts, set weekly and monthly anchors to 1D as a starting point.
IMPORTANT
Important Notes & Limitations
⚠Default settings are optimized for 1–5 minute chart scalping. If you're using higher timeframes, turn off lower timeframe and session levels to avoid chart clutter.
⚠Sessions and VWAPs only display on intraday charts. They hide automatically on daily charts and higher.
⚠TradingView caps line count at 500. Default settings produce roughly 265 lines. Turning on every line type for every timeframe with high counts can exceed the cap. The warning table at the top center will notify you.
⚠If higher timeframe levels don't appear correctly, check the Display Anchor setting. On intraday charts, set weekly and monthly anchors to 1D. On daily charts, set them to 1W.
⚠All previous-period levels are repaint-free. Once a level is drawn, that value will never change. Live VWAPs update in real time with every new bar.
⚠Works on any market with price data including stocks, crypto, forex, and futures.
Get Access
Get Supply and Demand Plus 9 More Premium Indicators
Access the full Premium Indicator Suite on your TradingView charts. All 10 indicators, chart templates, and priority support.
Each higher timeframe now has two distinct midlines. The CB 50% midline marks the midpoint of the previous candle's body (open-to-close, wicks excluded). The HL 50% midline marks the midpoint of the full range (high-to-low, wicks included). Both act as dynamic trend direction support and resistance — when price is above a midline, that timeframe is bullish. Use the 1-hour and 4-hour midlines for short-term direction and daily, weekly, and monthly midlines as longer-term targets. Price tends to bounce between higher timeframe midlines like a magnet.
Turn off the lower timeframe levels and trading session levels. Keep only the higher timeframe OHLC lines (daily, weekly, monthly), their midlines, and the volume spike levels from higher timeframes. This gives you a clean chart with only the most significant levels for multi-day position trades.
Yes. The indicator works on any market with price data including stocks, futures, forex, and crypto. It uses price structure, trading sessions, and volume spikes so it functions even on instruments where volume data is less reliable, though volume spike levels will be more accurate on instruments with deep volume reporting like futures.
Default settings produce roughly 265 lines, well under TradingView's 500 line cap. If your chart looks cluttered, turn off lower timeframe levels and session levels in settings. You can also choose to show only high/low lines, only midlines, or only open/close lines per timeframe. Use the price-tracking labels to identify levels at a glance instead of needing every type visible. If you exceed 500 lines, the warning table at the top center will alert you.
The indicator outputs a trend direction value (1 for bullish, -1 for bearish, 0 for neutral) based on up to four configurable filters — two VWAPs and two OHLC levels. The output only flips when all enabled filters agree. Other Trend Friend indicators with external filter inputs, like 1 Minute Scalping Indicator or Swing Trade & Scalp Signals, can use this value to only generate signals in the direction of the Supply and Demand trend.
The May 2026 rebuild is a major overhaul. Key changes include two independent VWAPs replacing the single VWAP, adaptive volume spike detection, two distinct midline types (CB 50% and HL 50%), current open lines, an external trend direction output, price-tracking labels replacing the old identification tables, Display Anchor settings for higher timeframe levels, extend lines right options, local timezone sessions, Pine Script v6, and a repaint-free guarantee. The 3-day OHLC levels, session premarket boxes, and old identification tables were removed.
The most effective combination is using Supply and Demand alongside the Buy Sell Indicator or Swing Trade & Scalp Signals. Use the new External Indicator Filter Trend Output to feed the Supply and Demand trend direction into your signal indicator so it only fires signals in the confirmed trend direction. Alternatively, wait for price to reach a supply or demand level, then look for a signal arrow confirming the reversal for high-probability entries with clear stop loss placement at the level boundary.
CHANGELOG
Release Notes
Major Rebuild — Dual VWAPs, Adaptive Volume & Trend Output
Complete rebuild with Pine Script v6 featuring two independent VWAPs, adaptive volume spike detection, two distinct midline types, current open lines, external trend direction output, price-tracking labels, Display Anchors, and a repaint-free guarantee.
New Features
•
Two independent VWAPs with separate reset timeframes (4H, 12H, 1D, 1W, 1M, 3M, or 12M), thickness, and previous-close lines
•
External Indicator Filter Trend Output — configurable 1/-1/0 value using up to 4 filters (2 VWAPs, 2 OHLC levels) that only flips when all enabled filters agree
•
Adaptive volume spike detection — rebuilt with adaptive weighting that calibrates to recent market conditions, replacing the static-lookback approach
•
Two distinct midline types per timeframe: CB 50% (candle body, open-to-close) and HL 50% (high-to-low), each independently toggleable
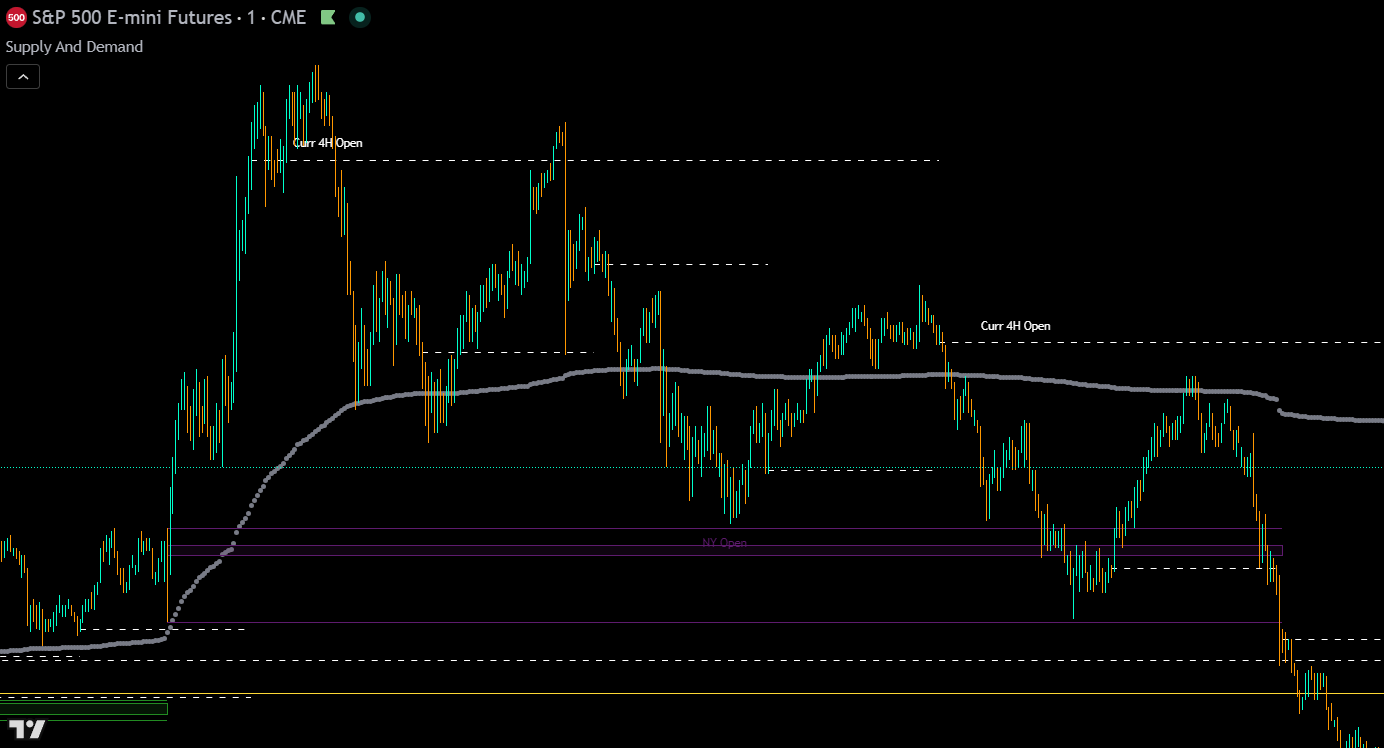
•
Current Open Lines — dashed line marking the open price of the in-progress candle on 1H, 4H, 1D, 1W, 1M, 3M, and 1Y
•
Price-tracking labels on every level type — follow the right edge of the chart for instant identification
•
Display Anchors for weekly, monthly, quarterly, and yearly levels — choose a lower timeframe trigger so HTF levels load correctly on intraday charts
•
Extend Lines Right toggles for daily, weekly, monthly, quarterly, and yearly timeframes
•
Full quarterly (3M) and yearly (12M) OHLC level support with the same line types, labels, and extend options
•
Warning table — alerts for Display Anchor issues and line count exceeding TradingView's 500 cap
Improvements
•
Local timezone sessions — Tokyo fires at 09:00 JST, London at 08:00 BST/GMT, New York at 09:30 ET regardless of DST
•
Reorganized settings panel — colors consolidated into four groups at bottom (OHLC, Volume Spike, Session, VWAP); comprehensive tooltips on every input
•
Updated to Pine Script v6 for better performance and newer language features
•
Repaint-free guarantee — all previous-period levels are confirmed repaint-free once drawn (live VWAPs update in real time)
Removed
•
3-day OHLC levels removed
•
Session premarket boxes removed
•
Old line identification and session identification tables replaced by price-tracking labels and warning table
Show older updates
Code Optimization
Optimized the code to resolve loading errors caused by TradingView reducing the allowed script size, while maintaining the same functionality.
What Changed
•
Optimized code to fit within TradingView's reduced script size limits. Same functionality, no loading errors
50% Midlines & Display Overhaul
Major overhaul adding 50% midlines for each higher timeframe level, new line type toggles, and reorganized settings. Midlines act as dynamic trend direction support and resistance.
What Changed
•
Added 50% midlines for each higher timeframe level which is the midpoint between high and low, acting as dynamic trend direction support and resistance
•
New toggles to show only high & low lines, only open & close lines, only midlines, or all, giving full control over which level types are displayed
•
Midlines given a single color setting (default white) for easy identification across all timeframes
•
Changed how lines are displayed and updated default settings for better out-of-the-box experience
•
Input menu rearranged for improved usability
Bug Fix & Default Settings
Minor bug fix and minor change to default settings.
Multi-timeframe trend detection with master trend, ranging market filters, and trend strength scoring. Use its trend direction to confirm whether supply and demand levels are likely to hold. Levels in the direction of the master trend produce the most reliable reactions.
A moving average ribbon designed for scalping that shows trend direction and momentum at a glance. Combine with Supply and Demand to enter scalp trades when price reaches a key level and the ribbon confirms the reversal direction.
Provide buy and sell signals across all types of markets. Based on pure price action and custom signal formulas to give reliable signals on any market and any timeframe.