Initial Release
First public release of the Combined Moving Averages indicator with 4 blended MA lines, cloud, volume spike coloring, squeeze detection and entry signals.
What's Included
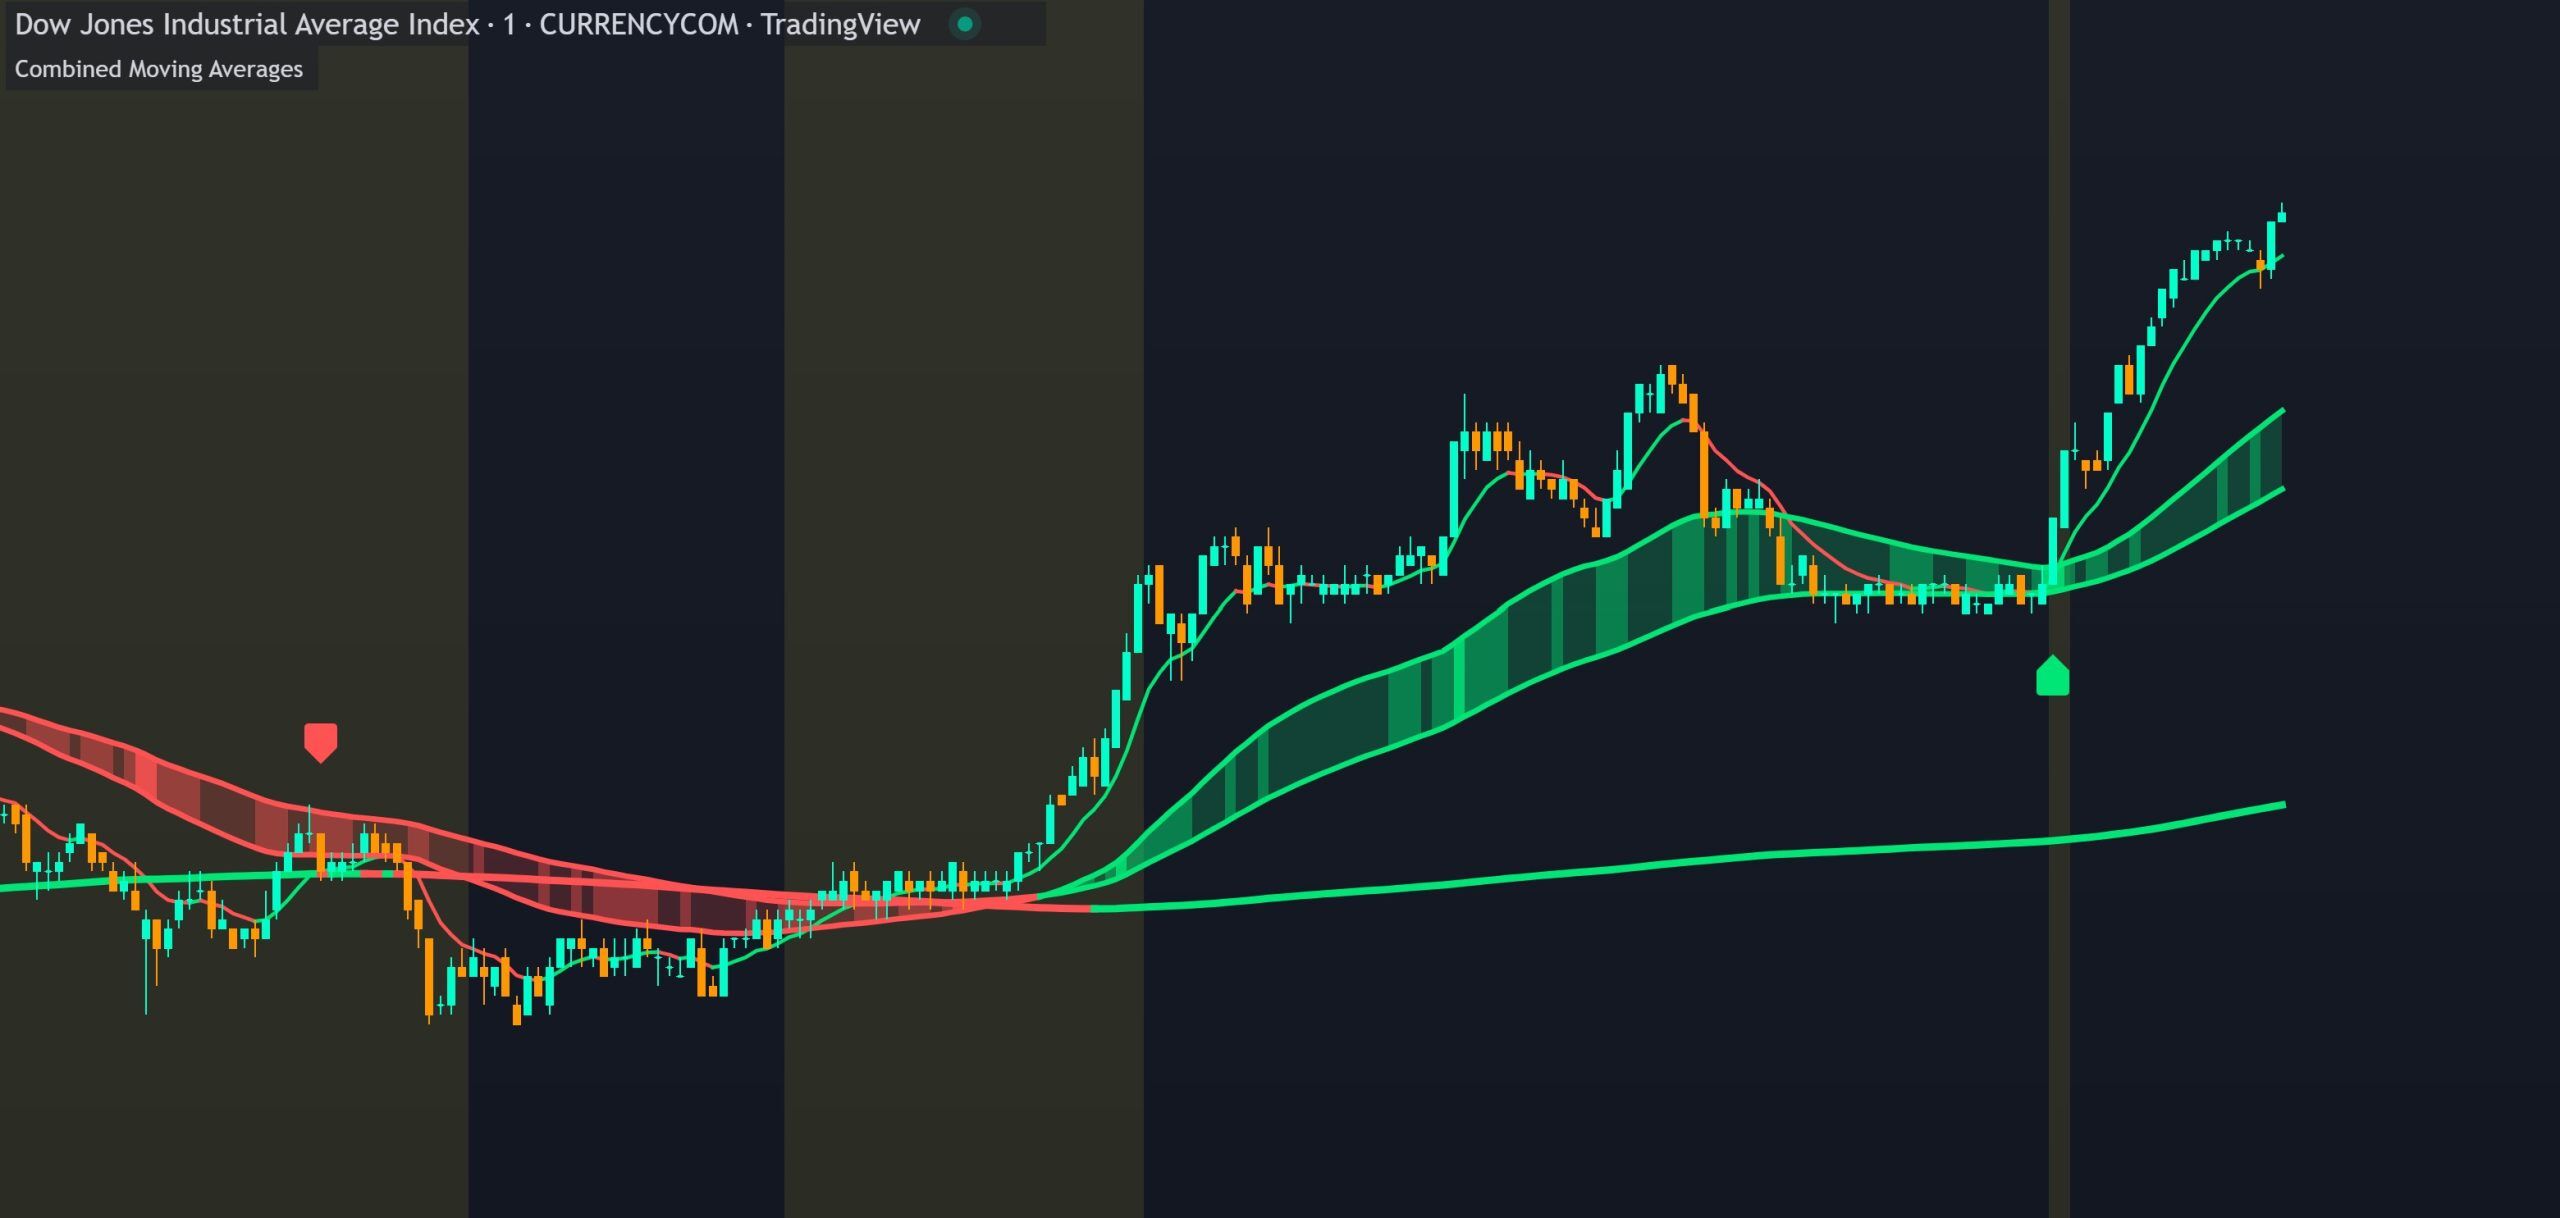
• 4 combined moving averages (each averaging EMA, SMA, HMA, RMA, WMA and VWMA)
• Cloud between the 50 and 100 MAs with volume spike brightness coloring
• Squeeze detection with yellow background and adjustable multiplier
• Confluence-based entry signals requiring cloud position, direction, MA alignment and volume spike
• Customizable lengths, sources and colors for each moving average