Alerts, Major Levels & Customization Update
Added alerts for all levels, major level highlights for high open interest strike prices with percentage updates, extendable lines and additional customization options.
What Changed
• Added alerts for each support and resistance level
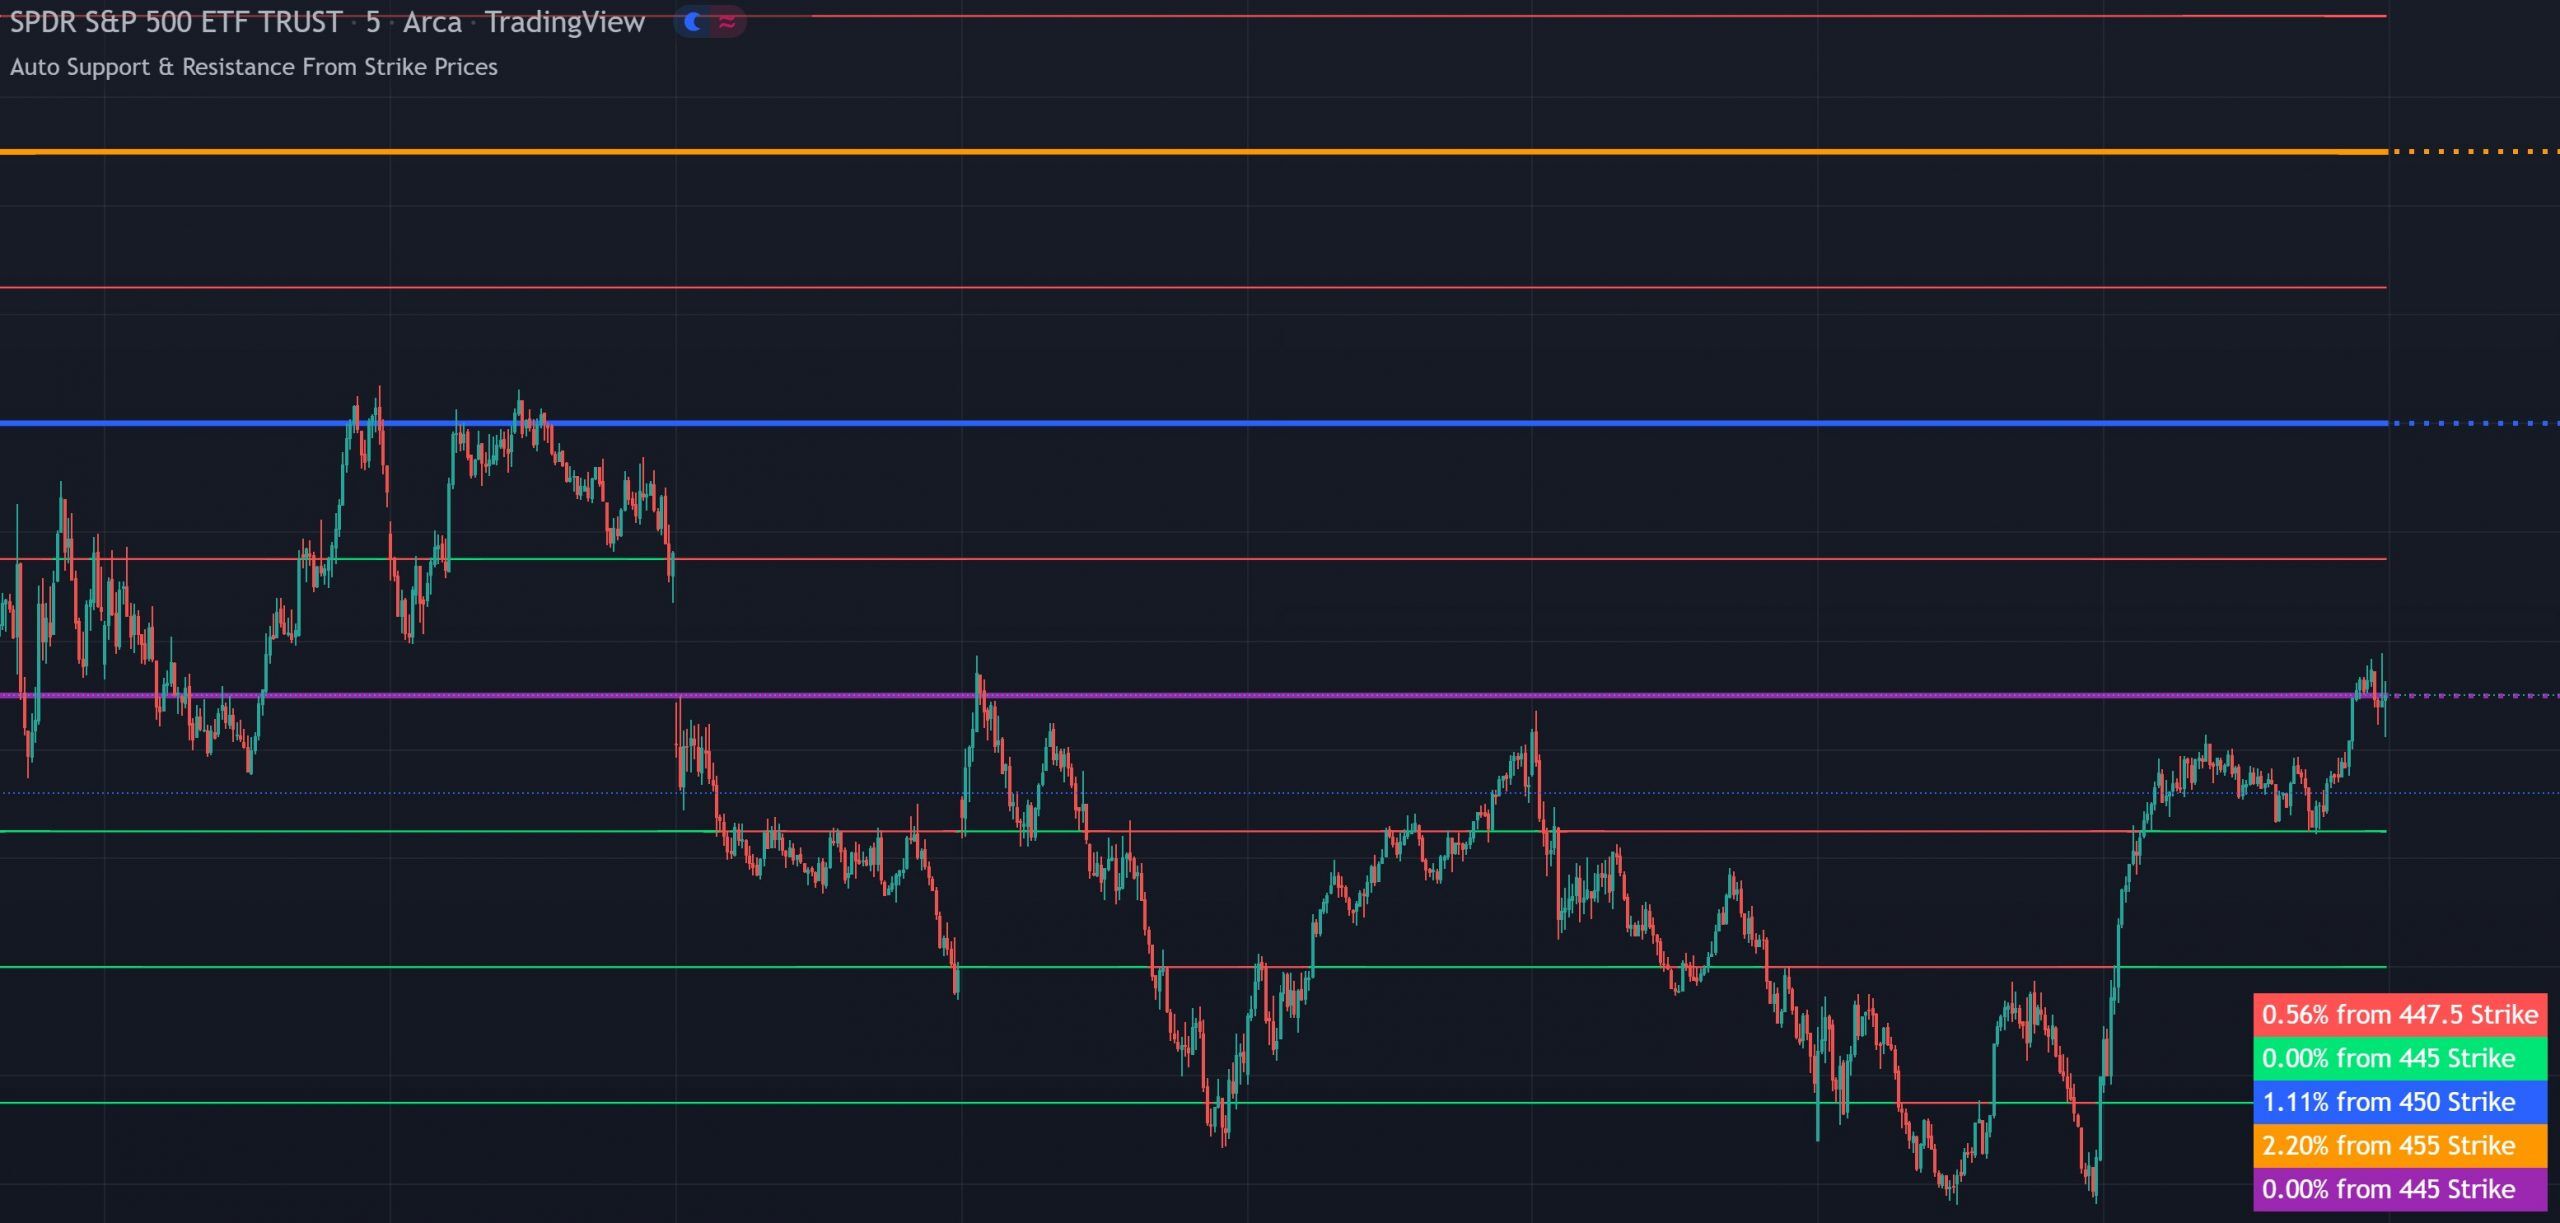
• Added major levels for high open interest strike prices with their own percentage gap updates
• Added extendable lines option
• Added additional customization options