Order Flow Indicator
For Tradingview

PREMIUM INDICATOR
The Order Flow Indicator is an advanced order flow analysis tool that processes lower timeframe (LTF) tick-level data to reveal the underlying buying and selling dynamics behind price movement. Using custom scoring formulas and proprietary weighting algorithms, this indicator transforms raw tick data into actionable visualizations that help traders understand market microstructure, detect potential institutional activity, and identify shifts in buying and selling pressure.
Unlike standard volume indicators that only show total volume per bar, this indicator analyzes every individual tick within each chart bar—potentially hundreds or thousands of data points—to calculate directional pressure, volume absorption, and large order detection with far greater precision.
Core Features
1. Institutional Buyer Histogram
The institutional buyer histogram identifies and displays large orders that likely represent institutional or professional trading activity. The indicator uses a proprietary classification system with an adaptive algorithm to detect which orders are the most important, automatically calibrating to different instruments and market conditions without manual adjustment.
Large orders are classified by direction:
- Buy Orders (green, above zero): Large orders where price moved up
- Sell Orders (red, below zero): Large orders where price moved down
- Neutral Orders (white, split across zero): Large orders with no directional impact
The tiered filtering system allows you to adjust sensitivity:
- Tier 1 Only: Shows only the absolute largest, most significant orders
- Tier 1 & 2 Only: Shows very large orders (default setting)
- Tier 1, 2 & 3 Only: Shows large orders with more frequency
- All Tiers: Shows all significant orders above normal retail size
- Use Order Size Filter Only: Bypass the adaptive tier system and filter purely by a specific order size threshold
An optional Size Filter can be enabled to set an absolute minimum order size in addition to tier filtering, allowing for precise control over which orders are displayed.
2. Buy & Sell Pressure Histogram
Visualizes the total directional pressure within each bar using a proprietary scoring system that weights volume by price impact. The histogram height represents total pressure intensity, while the color gradient—ranging from neutral gray to green (buying) or red (selling)—indicates how one-sided the activity was. Bars with strong directional conviction display more saturated colors, while mixed or balanced activity remains closer to neutral.
The color intensity is determined by custom adaptive algorithms that compare current activity against recent historical context, providing meaningful visual feedback about the strength and conviction of each bar’s order flow.
3. Absorption Histogram
Detects when significant volume occurs without proportional price movement. High absorption readings suggest that large orders may be getting filled without moving the market, potentially indicating institutional order flow, strong support/resistance levels, or an active battle between buyers and sellers. This can mean a reversal is coming or that the move is exhausted.
The indicator uses proprietary efficiency calculations and adaptive normalization to compare current absorption against recent historical context, automatically adjusting to different market conditions and volatility.
4. Neutral Volume Histogram
Displays cumulative volume where price remained unchanged between ticks. Elevated neutral volume may indicate consolidation, indecision, or large orders being executed at a single price level without directional impact. These are typically limit orders where institutional buyers were trying to get their orders filled without moving the markets.
5. Order Flow Trend Line & Moving Averages
Tracks cumulative directional order flow over time, resetting at user-defined intervals (hourly, daily, weekly, etc.). Two calculation methods are available:
- Basic: Raw cumulative volume delta (up volume minus down volume)
- Advanced: Uses the proprietary scoring system for volume-weighted directional measurement
Three time-based moving averages (default: 15min, 1H, 4H) provide trend context. Unlike traditional bar-based MAs, these automatically calculate the appropriate length based on your chart timeframe, ensuring consistent time periods across different charts. Optional color-filled areas show when the trend line is above or below each MA for quick visual reference.
How To Read The Indicator
Institutional Histogram Interpretation
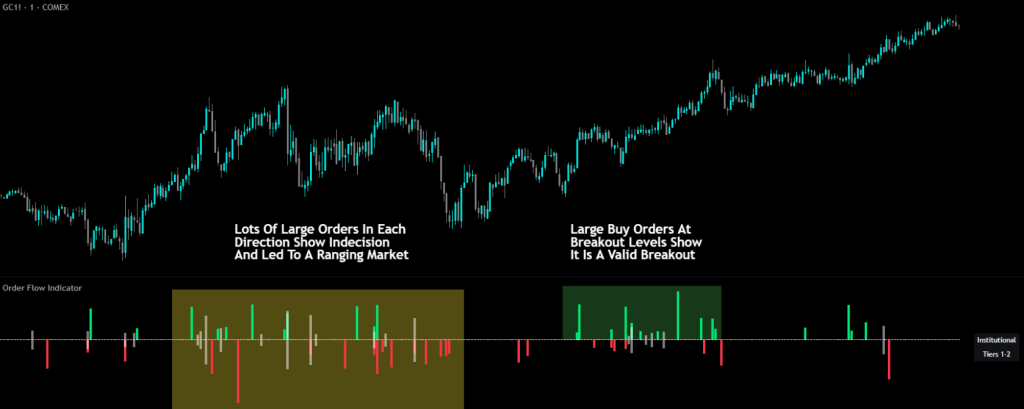
- Green spikes above zero = Large buying orders detected
- Red spikes below zero = Large selling orders detected
- White spikes above and below zero = Large neutral orders detected
- Simultaneous buy and sell spikes = Two-sided institutional activity (potential reversal zone or high-interest price level)
- The identification table on your chart shows which tier filter is active and any size filter threshold
Pressure Histogram Interpretation
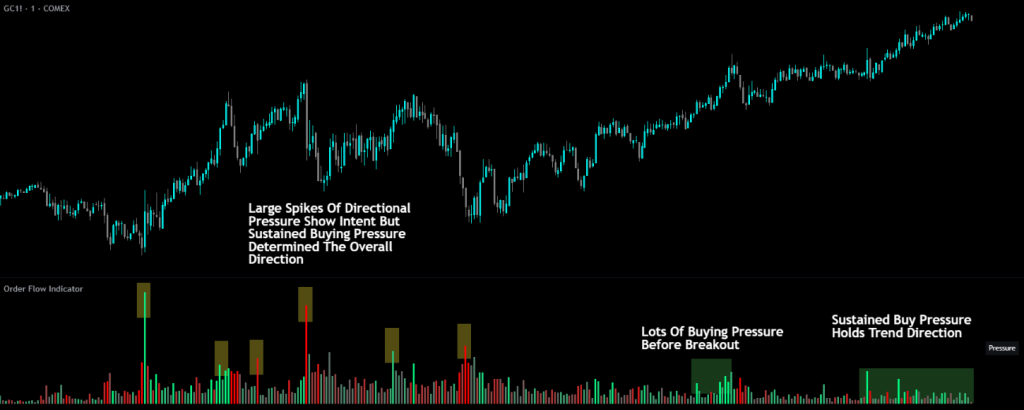
- Tall bars with saturated green = Strong, mostly one-sided buying pressure
- Tall bars with saturated red = Strong, mostly one-sided selling pressure
- Shorter or gray-tinted bars = Lower conviction or balanced activity from buyers and sellers
Absorption Histogram Interpretation
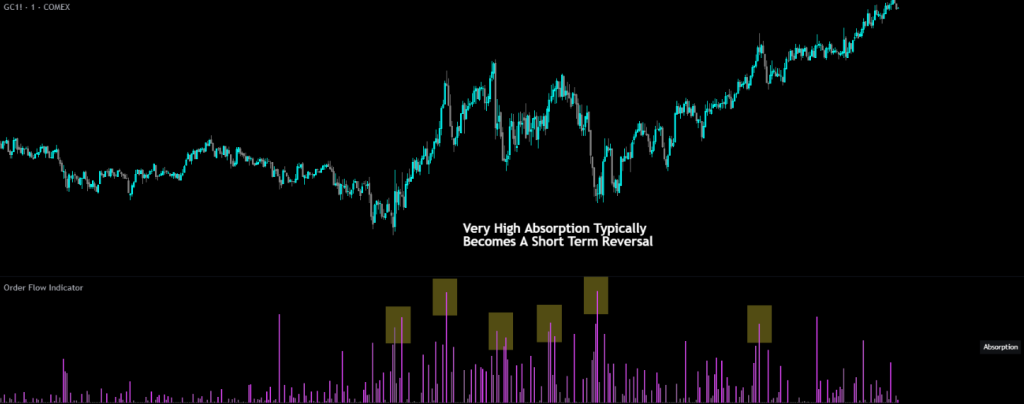
- Tall bright bars = High volume absorbed without moving price (potential reversal or exhaustion of the move)
- Low/absent bars = Volume efficiently moving price as expected
Neutral Volume Histogram Interpretation
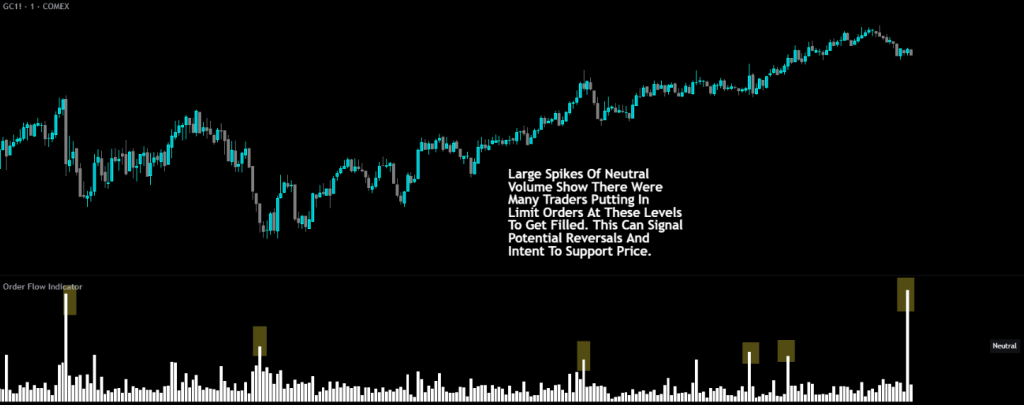
Large neutral volume signals clusters of limit orders from large buyers and sellers looking to fill their orders without moving the market. This can signal a potential reversal, or intention to support price from that area.
Trend Line Interpretation
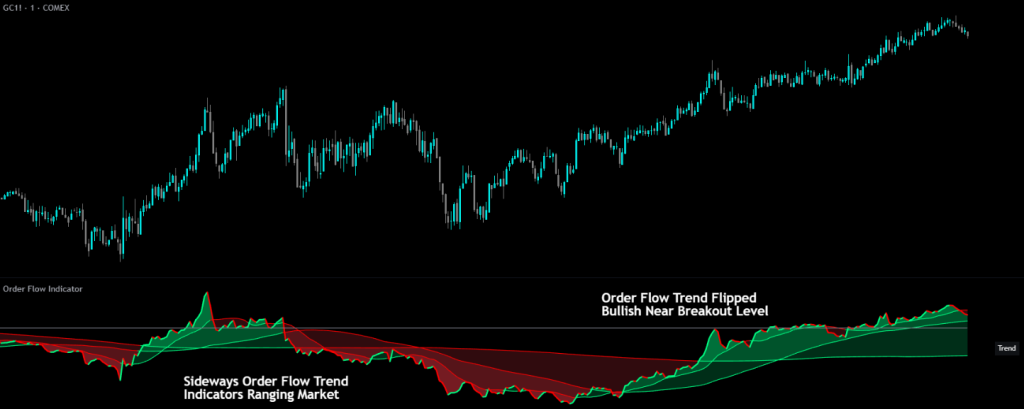
- Rising trend line (green) = Cumulative buying pressure increasing
- Falling trend line (red) = Cumulative selling pressure increasing
- Trend crossing above/below MAs = Potential shift in order flow momentum
Trading Applications
Scalping & Intraday Trading
Use the Institutional Histogram to identify when large players are entering the market. Imbalances between institutional buying and selling often precede short-term price movements. Watch for a strong directional bias from large orders and then look for pullbacks to enter positions in the same direction of the large order bias.
Watch for high spikes in absorption after an extended move up or down. This typically represents a reversal is coming or that the move is exhausted and a pullback to fair price areas is likely so trail your stop tightly if you are already in a position or use the absorption spike as a signal to watch for a potential entry near that spike candle.
Support & Resistance Confirmation
High Absorption readings at key price levels may confirm that orders are being absorbed, strengthening the case for support or resistance. Clusters of absorption can help identify accumulation and distribution zones. These often have price reactions that can be scalped for quick profits by trading back towards where price approached the support/resistance level from.
Use our order block indicator for support and resistance levels, and then look for high absorption when price touches those levels indicating large buyers stepping in to protect their positions, which can be excellent bounces for scalp trades.
Trend Confirmation
The Order Flow Trend Line can confirm or diverge from price trends. Strong price moves accompanied by aligned order flow provide higher conviction. Divergences between price and cumulative delta may signal weak conviction from traders and indicate a potential reversal is coming.
Institutional Order Detection
Filter for only the largest orders (Tier 1) to see when potential institutional players are most active. These rare, significant orders often precede meaningful price moves. When you see a clear bias in direction from the institutional traders, look for pullbacks and then enter a position in the same direction as the large trader bias.
Volume Analysis
Compare Pressure and Neutral Volume histograms together. High pressure with low neutral volume suggests conviction moves, while high neutral volume with low pressure may indicate consolidation or absorption.
Settings Overview
Global Settings
- Data Source: Analyze order flow from a different symbol (e.g., ES1! while viewing SPY). Leave empty to use the current chart symbol.
- Lower Timeframe: The granularity of tick data analysis (default: 1T for 1-tick). Lower timeframes provide more accurate data but have limited historical depth.
- Only Show Data For Confirmed Bars: When enabled, only displays data after bars close to prevent values from updating on open bars.
Institutional Buyer Histogram Settings
- Order Size Tier Filter: Adjust sensitivity from Tier 1 (largest orders only) through All Tiers (broader detection), or use Size Filter Only mode
- Only Show Orders Above Filter Threshold: Enable an additional absolute minimum order size filter
- Order Size Filter Threshold: Set a specific minimum volume when the size filter is enabled
- Color Settings: Customize buy, sell, and neutral order colors
Buy & Sell Pressure Histogram Settings
- Enable/disable and invert the histogram
- Customize buy pressure, sell pressure, and base colors for the gradient system
Absorption Histogram Settings
- Enable/disable and invert the histogram
- Customize absorption and base colors
Neutral Volume Histogram Settings
- Enable/disable and invert the histogram
- Customize the neutral volume color
Order Flow Trend Settings
- Calculation Method: Basic (raw delta) or Advanced (proprietary scoring)
- Smoothing Length: Apply SMA smoothing to the trend line (1 = no smoothing)
- Reset Period: When cumulative values reset (5min through 1 Year)
- MA 1/2/3 Timeframes: Time-based moving average periods (each can be independently enabled)
- MA Fill: Optional color fill between trend line and MAs
Identification Table
- Enable/disable the on-chart table showing active features
- Customize position, background color, and text color
Important Notes & Limitations
Lower Timeframe Data Requirements
This indicator is designed to work with tick-level data (1T timeframe) for maximum accuracy. The quality of analysis depends directly on the granularity of data available:
- Tick-based intervals require a paid TradingView subscription (Ultimate plan)
- Historical tick data is very limited — even on the Ultimate plan, only 40,000 bars of historical tick data is available which can be days worth of data on some charts and only hours worth of data on charts like NQ where there are a large amount of traders constantly buying and selling.
- Second-based data requires Premium or Ultimate plans. This will give you more history to work with, but multiple transactions can happen within a single second bar, so the data, especially directional data will not be as accurate as tick level data.
- Using higher LTF settings (such as 1-minute) will still work but provides less granular order flow analysis
For complete information on data availability by subscription tier, see the TradingView pricing page.
Volume Data Required
This indicator requires volume data to function. Instruments without volume data (such as some forex pairs from certain brokers) cannot be analyzed with this tool.
Real-Time Updates
Without “Only Show Data For Confirmed Bars” enabled, the current bar’s values will update in real-time as new ticks arrive. Enable this setting if you prefer to act only on finalized data that will not change upon bar confirmation.
Instrument Compatibility
While designed primarily for futures trading analysis, this indicator works on any instrument with volume data including stocks, forex, ETFs, and cryptocurrencies.
Using Multiple Instances Of The Indicator
There are multiple different options for you to use on this indicator, but having them on the same pane can be confusing and not obvious when the data overlaps. To fix this, just add a second or third instance of the indicator to your chart and then switch on the specific tool you want to use for that indicator pane. My personal favorite is the absorption on one pane and the institutional buyer histogram on another pane for easy analysis of both.
If you want to combine two histograms onto one indicator pane such as absorption and neutral volume, just enable the inversion setting on one of the tools so you get data on the positive side and negative side of the zero line and reduce how much space your indicator setup consumes of your chart.
Fix Indicator Loading Error
If the indicator fails to load or displays incorrectly, toggle the “Fix Indicator Loading Error” checkbox in settings. This forces TradingView to restart the indicator and typically resolves loading issues. Tradingview charts have issues with parsing tick data sometimes too, so if you see gaps between readings, try refreshing your browser. Most of the time that fixes the issue with gaps in data. If that does not resolve the issue, there may not be any tick data available from the exchange during that time period.
Default Configuration
Out of the box, the indicator displays:
- Institutional Buyer Histogram: Enabled with Tier 1 & 2 filter
- Identification Table: Enabled (shows active features and current tier selection)
- All other features: Disabled
This provides immediate value by showing large order detection without overwhelming the chart. Enable additional features as needed for your trading style.
Release Notes
March 18, 2026
This update completely overhauls the Order Flow Trend Line with a new, far more accurate data source and reorganizes the settings panel for a cleaner experience. All histogram tools remain unchanged.
Major Upgrade: Exchange-Classified Volume Delta
The Order Flow Trend Line now pulls volume delta directly from the exchange using TradingView’s native footprint data. This is a significant upgrade from the previous version which estimated buying and selling direction based on price movement between lower timeframe bars. That old method was an approximation that had to guess whether volume was buying or selling based on which direction price moved between ticks.
With the new footprint data, every unit of volume is classified as a buy or a sell by the exchange itself. This means the trend line now shows you actual buying and selling pressure rather than an estimate of it. The result is a much more accurate and reliable trend line.
The old “Calculation Method” dropdown (which let you choose between “Advanced” and “Basic”) has been completely removed since there is now only one data source and it is the most accurate one available.
Much More Historical Data
The previous version relied on lower timeframe tick data which had very limited historical depth, especially on lower chart timeframes. The new footprint data source provides significantly more history. Minute charts will now pull weeks of data and daily charts will pull years of data. This means the trend line and its moving averages have much more data to work with, making them useful across a wider range of timeframes and lookback periods.
Lower Subscription Requirement For The Trend Line
The previous version required a TradingView Ultimate subscription to access the tick-level data that powered the trend line. The new footprint data requires a TradingView Premium subscription instead of Ultimate. This makes the trend line accessible to more traders at a lower cost. Note that the four histogram tools (Buy & Sell Pressure, Absorption, Neutral Volume, and Institutional Buyer) still use lower timeframe tick data and still require an Ultimate subscription for tick-based intervals. If you just want to use the Order Flow Trend tool, but only have a premium subscription, you can just switch the lower timeframe interval for the other built in tools to 1 second instead of 1 tick and then it will load without issue.
New "None" Option For Reset Period
A new “None” option has been added to the Reset Period setting. When selected, the cumulative delta builds continuously without ever resetting to zero. This is useful if you want to see the overall trend in buying versus selling pressure over a longer period without interruption. The default reset period remains “1D”.
Default State Changes
The trend line is now enabled by default since it is now the primary tool with the most accurate data. The institutional buyer histogram is now disabled by default. You can toggle either of these on or off at any time in the settings.
Settings Panel Reorganized
The settings panel has been reorganized for clarity. The old “Global Settings” group has been split up. The new layout from top to bottom is:
- Real Time Value Non-Repaint Settings
- Order Flow Trend Settings
- Data Settings For All Tools Below This
- Buy & Sell Pressure Histogram
- Absorption Histogram
- Neutral Volume Histogram
- Institutional Buyer Histogram Settings
- Identification Table
The trend line settings now appear first and are clearly separated from the histogram data settings. The “Data Settings For All Tools Below This” group contains the Data Source and Lower Timeframe inputs which only affect the four histogram tools below it. The trend line is not affected by these settings since it uses its own native exchange data.
What Was Not Changed
All four histogram tools (Buy & Sell Pressure, Absorption, Neutral Volume, and Institutional Buyer) remain completely unchanged. Their calculation logic, data pipeline, plotting, and all related settings work exactly the same as before. The identification table, MA calculations, fill logic, and all color settings are also unchanged. It is recommended that you have a Tradingview Ultimate Plan with tick data if you plan on using these tools as their accuracy will be much better than using second intervals.
March 19, 2026
Updated the request.footprint() call parameters to improve performance on tickers with large amounts of ticks per bar.