Order Flow Candles
Indicator For Tradingview

PREMIUM INDICATOR
Order Flow Candles is an advanced candle coloring indicator that visualizes the strength and direction of market pressure on each bar. Unlike traditional candlestick charts that simply show whether price closed higher or lower than it opened, this indicator reveals the intensity of buying or selling pressure through a gradient color system. The indicator employs custom formulas that combine two independent analysis methods—price action scoring and order flow analysis—to produce a pressure reading that determines each candle’s directional color intensity.

The Dual Analysis Approach
This indicator stands apart from simple candle coloring tools by using two distinct analytical layers that work together:
Price Action Analysis evaluates each candle’s structure and compares it to multiple previous candles. Rather than looking at a single bar in isolation, the indicator examines how the current candle’s size and values compare across several prior bars to establish context. This multi-candle approach helps distinguish between genuine momentum and single-bar noise. The analysis considers factors such as whether the candle is extending beyond previous ranges or failing to do so, whether the candle size indicates conviction or indecision, and whether the overall range suggests strength or weakness. Proprietary adjustment algorithms then modify the raw score based on candle characteristics—smaller, weaker candles receive reduced scores while larger conviction candles receive appropriate emphasis. Gap bars at market open are handled separately to prevent misleading readings from overnight price changes.
Order Flow Analysis examines lower timeframe data to determine actual buying versus selling volume within each chart bar. By analyzing price movements and their associated volume on a granular level, the indicator classifies activity as buying pressure or selling pressure. This raw data is then normalized using adaptive calculations based on rolling historical averages, allowing the indicator to respond appropriately to current market conditions rather than relying on fixed thresholds that may not suit all instruments or market environments.
The two scores are then blended together based on user preference, creating a combined pressure reading that benefits from both analytical perspectives.
Understanding The Color System
The indicator uses a 10-tier gradient in each direction:
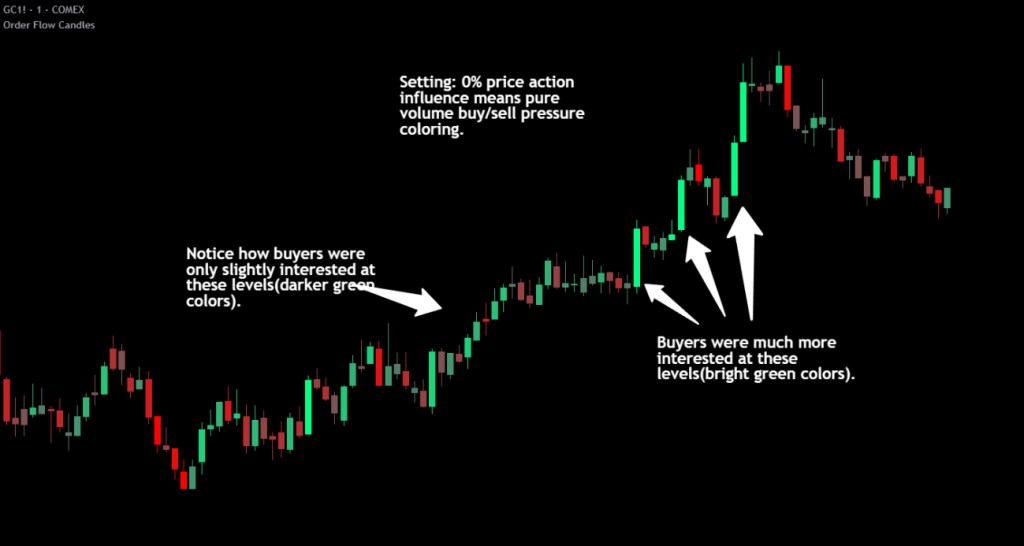
- Bright Green – Strong buying pressure with high conviction
- Medium Green – Moderate buying pressure
- Dim Green – Weak buying pressure or mixed signals
- Gray – Neutral—no significant directional pressure
- Dim Red – Weak selling pressure or mixed signals
- Medium Red – Moderate selling pressure
- Bright Red – Strong selling pressure with high conviction
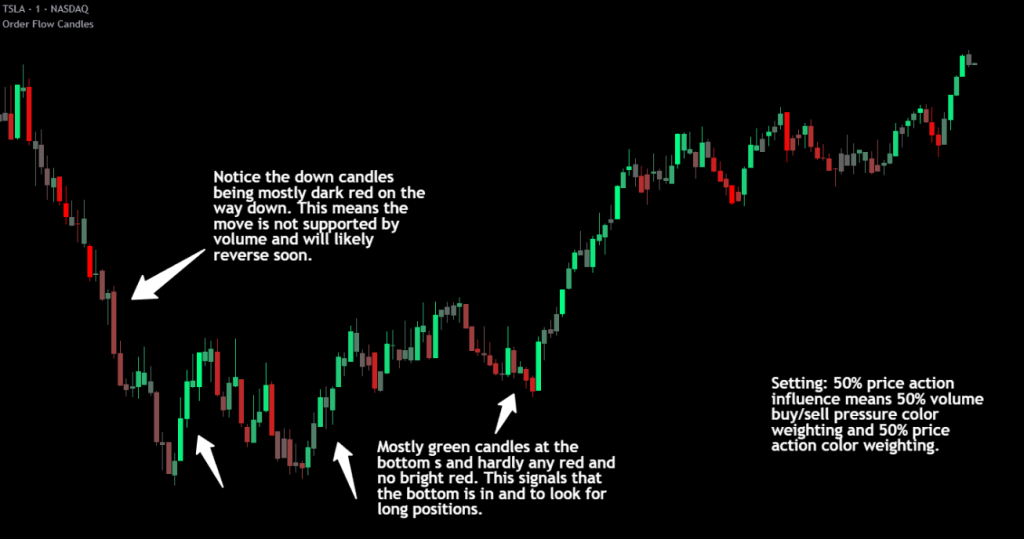
The key insight is that candle direction alone does not tell the full story. Strong candles with strong directional volume and movement will show bright colors to represent the strength of that candle’s direction. Weak and indecisive candles will appear darker to indicate that there was a lack of directional conviction.
The colors used can be customized by setting the bullish color, bearish color and base color. The base color will be mixed with the directional color when directional conviction is low.
How To Use This To Trade
Trend Confirmation and Trade Management
Bright colored candles indicate strength and conviction. When you see consecutive bright candles in the same direction, this suggests sustained momentum worth riding. During these moves, consider trailing your stop loss tightly to protect profits while allowing the trend to continue. The brightness of the candles serves as a real-time gauge of how much conviction remains in the move.
Reversal Detection
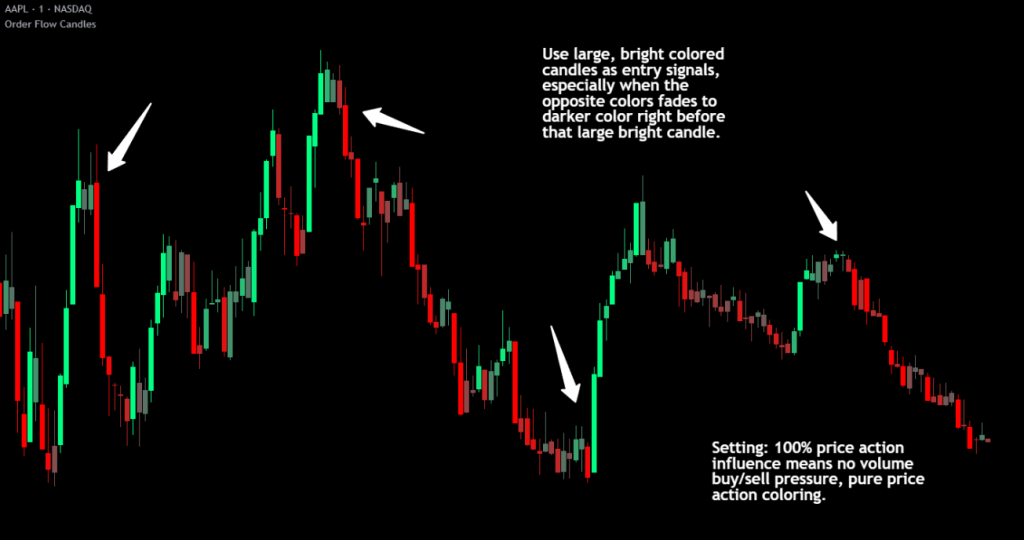
Reversals typically do not occur suddenly. Watch for a darkening of colors leading up to potential reversal points. Darker, dimmer candles indicate indecision and combative pressure from both buyers and sellers. When bright candles begin transitioning toward gray or dim colors—especially at key support/resistance levels—this often precedes a change in direction. A sequence like bright → medium → dim → gray suggests momentum is fading and a reversal or consolidation may follow.
Entry Identification
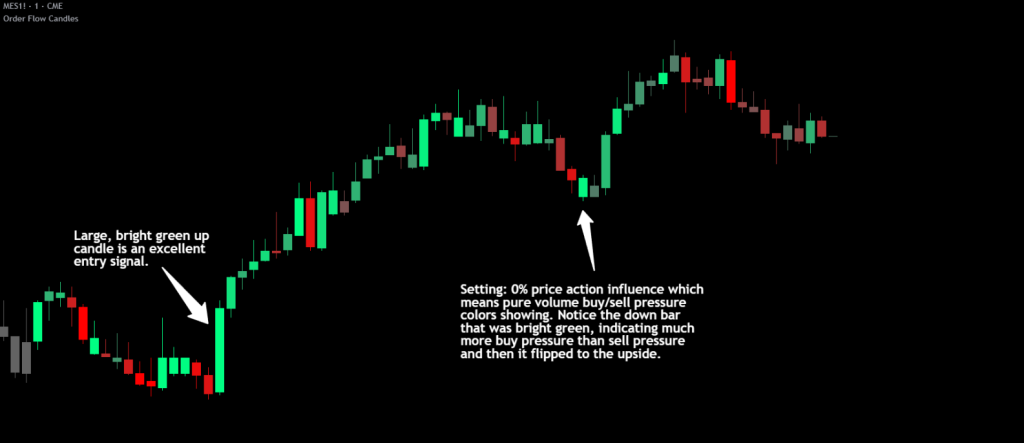
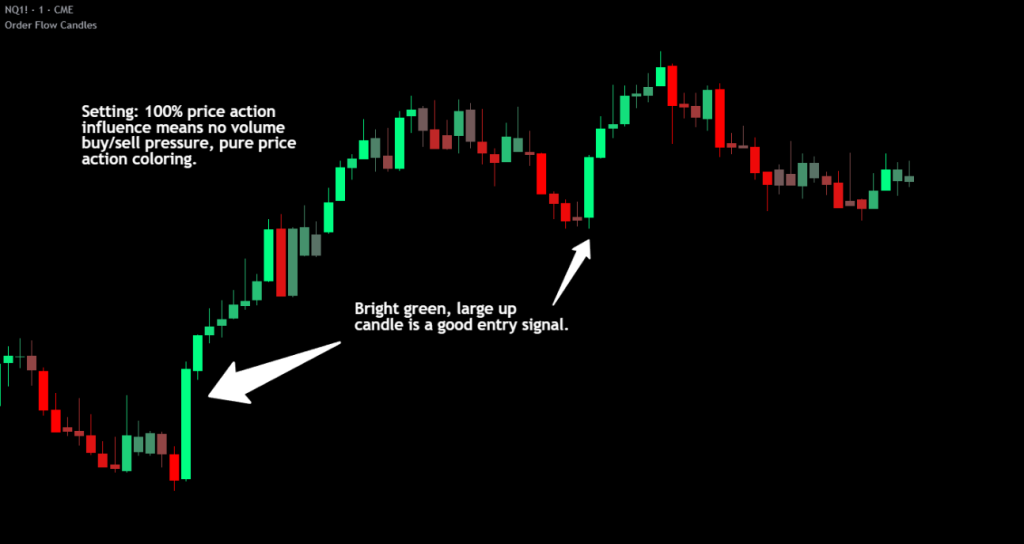
Large bright candles appearing at pivot points or key levels often represent strong entry opportunities. These candles show that one side has taken decisive control with conviction. When price reaches a significant support or resistance level and produces a bright candle in the expected direction, this confluence of price level and pressure confirmation can provide higher-probability entries.
Detecting False Moves
One of the most valuable applications involves watching for color-to-direction discrepancies when using volume weighting. If you see a green candle (close above open) but the indicator colors it toward red or gray, this means the underlying volume pressure contradicts the candle’s direction. This divergence suggests the move may be false and could soon reverse. The order flow component is detecting selling pressure despite the bullish candle structure—a warning sign that the apparent strength lacks genuine support.
Consolidation Recognition
Extended periods of gray or dim candles indicate low conviction and indecision. These periods often represent consolidation ranges where neither buyers nor sellers have control. Such conditions may precede significant breakouts, making them useful for identifying potential setup zones.
Validating Areas Of Interest
Watch the candle colors and you will notice that in tight ranges, the candles will be darker and rarely have very bright colors, but once price reaches the edges of a range and has multiple bright colored candles, this validates that traders are now ready to move outside of that range and place directional trades. Use the bright colored candles to reveal where traders are interested in entering positions and use that conviction to your advantage.
Settings Guide
Lower Timeframe – Sets the granularity for volume analysis. Lower timeframes like 1T provide more detailed data but may have limited historical depth on TradingView. Adjust based on your chart timeframe and data availability.
Price Action Influence % – Controls the blend between price action scoring and volume/order flow scoring. At 0%, the indicator uses pure order flow analysis. At 100%, it uses pure price action analysis. The default 50% provides equal weighting to both methods. Consider increasing toward 100% for instruments with unreliable volume data such as forex pairs or certain CFDs. For futures contracts with excellent volume reporting, values around 50% often work well.
Candle Color Settings – Customize the buy color (default bright green), sell color (default red), and base/neutral color (default gray) to match your chart theme and personal preferences.
Fix Loading Error – Toggle this checkbox if the indicator fails to load, displays incorrectly or starts lagging. This forces TradingView to restart the indicator and typically resolves any issues.
Instrument and Timeframe Considerations
The order flow component requires reliable volume data for optimal results. Consider these guidelines:
- Futures: Generally provide excellent volume data and work well with lower Price Action Influence settings
- Stocks: Good volume data during regular trading hours
- Forex: Volume reliability varies by exchange; test before relying heavily on volume scoring
- Crypto: Volume reliability varies by exchange; test before relying heavily on volume scoring
- Index CFDs: Often have poor volume data; higher Price Action Influence recommended
Higher timeframes (daily, weekly) typically produce more reliable color readings with less noise. Lower timeframes can be useful for timing entries within the context of higher timeframe analysis.
The indicator requires a brief initialization period—approximately 60 bars for full accuracy as the adaptive calculations populate their historical reference data.
Practical Guidance
Order Flow Candles works effectively when combined with other analysis methods. Consider using it alongside support/resistance levels, where bright candles at key zones can confirm breakouts or bounces. Volume profile analysis pairs naturally with this indicator, as does traditional structure and trend analysis.
The indicator is designed as a visualization and decision-support tool. It helps quantify and display information that might otherwise require mentally processing multiple data points. However, profitable trading requires more than entry signals—risk management, position sizing, and broader market context remain essential components of any complete trading approach.
Limitations
- When using any amount of volume weighting, the candles will show as grey until it has had enough previous bars to establish baseline averages to use for calculations. When using tick data on higher than 1 minute charts, the number of chart bars you get data will be limited, so try adjusting the lower timeframe to use a higher timeframe for more data. Or you can switch to 100% price action influence to get price action only candle coloring for the entire data set
- Volume analysis accuracy depends entirely on the quality of volume data available for your chosen instrument so make sure to look at charts with the most reliable volume data for best results
- Lower timeframe data has limited historical depth on TradingView; older bars may have less accurate order flow readings
- First bars of new trading sessions (gap bars) are scored conservatively and may appear dimmer than expected
- During extremely fast market conditions, lower timeframe data may lag slightly
- The indicator provides decision support but is not a complete trading system on its own, so use this indicator as a guide to make decisions, but do not rely solely on it
Release Notes
March 17, 2026
This is a major update that significantly improves the accuracy and usability of Order Flow Candles. TradingView recently released a new footprint data framework for Pine Script v6, which for the first time gives indicator developers access to real buy and sell volume data directly from the exchanges. This was not available when the previous version was built, so we updated the indicator with this new technology as soon as it became available. The indicator now uses actual exchange-reported volume data instead of estimating it, provides dramatically more historical data, no longer requires the most expensive TradingView subscription tier, introduces Delta Multiple Circles for spotting large directional volume, and adds buy/sell signal arrows with configurable alerts.
Upgraded Volume Data — Footprint Data Integration
The indicator now uses TradingView’s native footprint data to calculate buying and selling pressure instead of the previous method of requesting lower timeframe tick data and estimating volume direction from price movement.
The previous version had to guess whether volume was buying or selling by looking at which direction price moved on each individual tick. This was the best method available at the time, but it was still an estimation. The new version uses footprint data where buy and sell volume comes directly from the exchanges themselves, so there is no guessing involved. The data tells you exactly how much volume was on the buy side and how much was on the sell side for every bar. This makes the candle coloring significantly more accurate when using any amount of volume weighting.
Dramatically More Historical Data
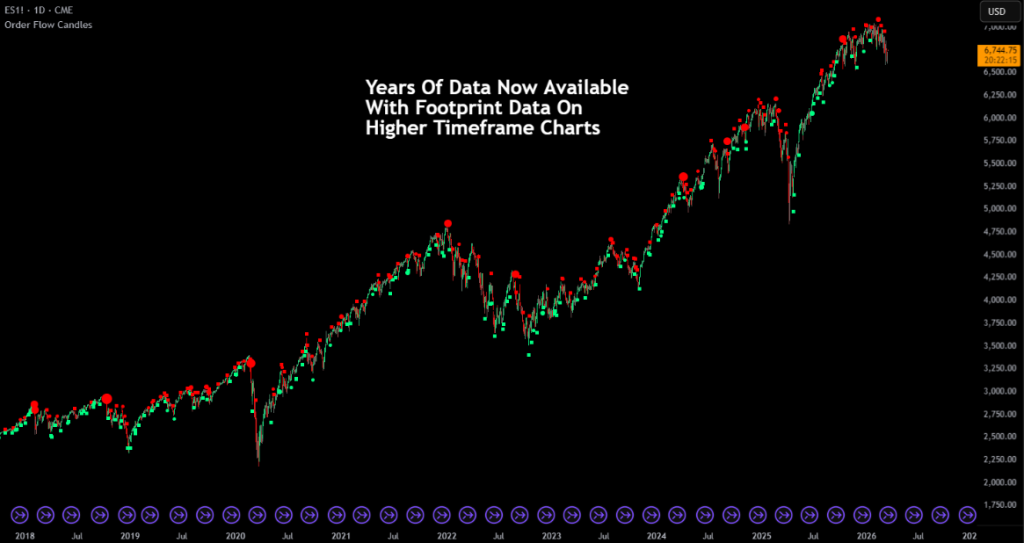
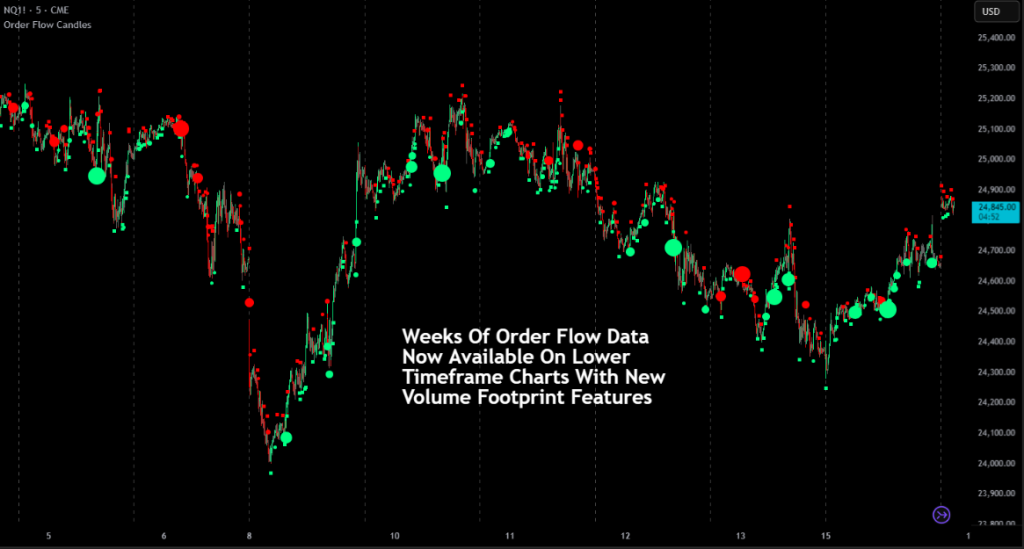
The old tick data method was extremely limited in how far back it could look. On high volume markets like ES1! and NQ1!, you would sometimes only get a few hours of tick data before the candles turned gray because there was no more data available. With footprint data, you now get weeks of data on lower timeframe charts and years of data on higher timeframe charts, so the indicator displays colored candles across far more of your chart history.
Lower Subscription Requirement
The previous version required tick-level data (1T timeframe) which was only available on TradingView’s Ultimate plan. Footprint data is available on TradingView’s Premium plan, so you no longer need the highest tier. Please note that a TradingView Premium subscription (or higher) is still required to use this indicator as TradingView requires a Premium plan to access footprint data.
The “Lower Timeframe” setting has been removed since the indicator now pulls footprint data automatically.
New Feature — Delta Multiple Circles
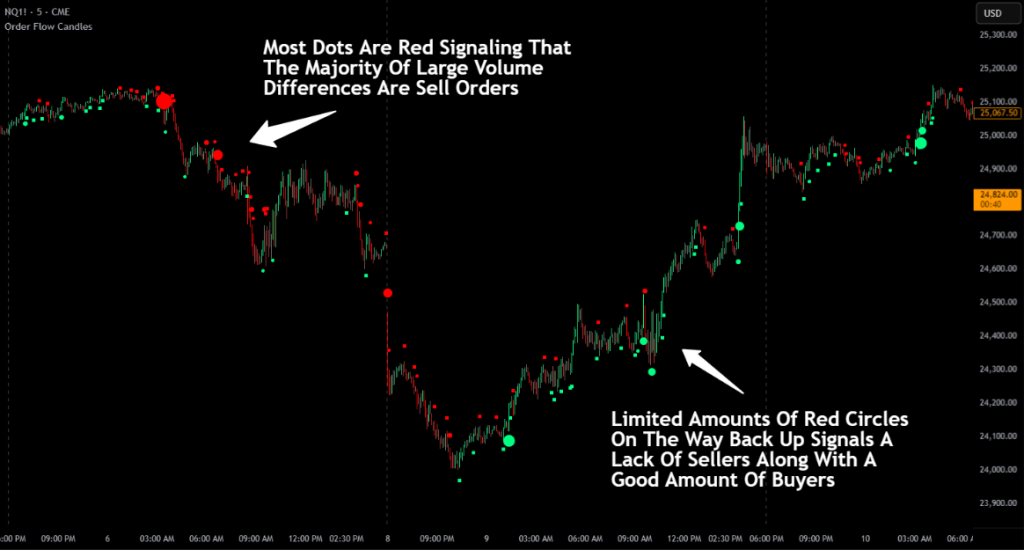
Delta Multiple Circles help you spot when unusually large amounts of directional volume come into the market. Delta is the difference between buying volume and selling volume on a candle. If more volume is on the buy side, the delta is positive (bullish). If more is on the sell side, the delta is negative (bearish).
The indicator uses an adaptive algorithm to calculate an accurate average of the recent delta that adjusts quickly to changing market conditions. This means the baseline stays relevant no matter what asset you are trading or how volatile the market is. When the delta on a candle is significantly larger than that adaptive average, a circle appears near the candle. The bigger the delta compared to the average, the bigger the circle. There are 10 size tiers.
Positive delta circles appear below the candle in the buy color. Negative delta circles appear above the candle in the sell color. Large spikes in directional volume often happen before price fully reacts to that volume. This can help you get into a position early if the volume supports a move, or get out if large volume is coming in against you.
Delta Multiple Circle Settings:
- Enable Delta Multiple Circles — Toggle the feature on or off.
- Circle Buy/Sell Color — Customize the colors for positive and negative delta circles.
- Delta Increment — Controls how much extra delta above average is needed for each larger circle size. With the default of 1.0, a delta of 2x the average produces the smallest circle, 3x the next size up, and so on up to 11x for the largest. Lower values make circles appear more often, higher values make them rarer.
- Circle Size Per Tier — Controls how visually large each circle tier appears on your chart. Increase this if the circles are hard to see.
New Feature — Buy and Sell Signal Arrows With Alerts
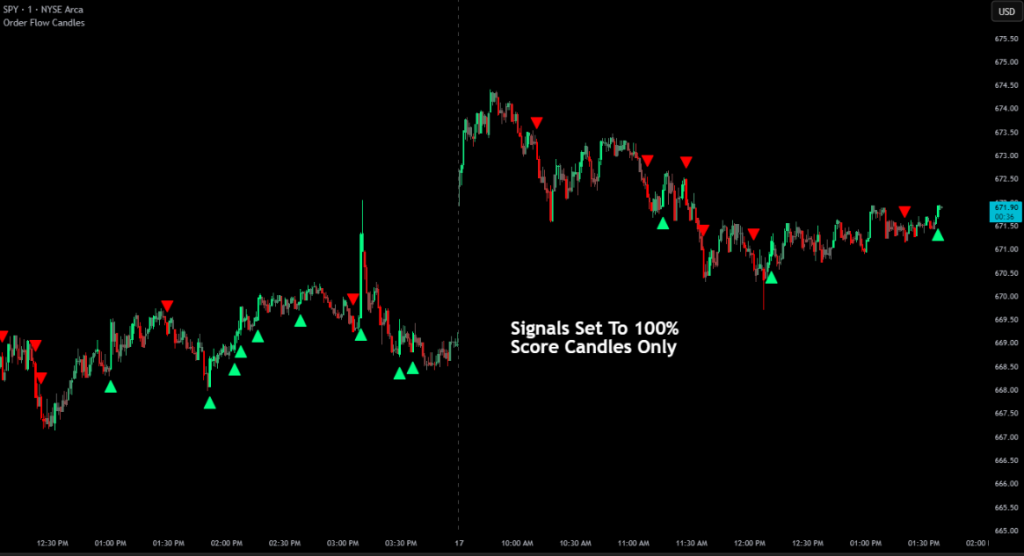
This update adds buy and sell signal detection with on-chart arrows and TradingView alerts. A signal fires when a candle’s final score from whichever Candle Coloring Mode you have selected reaches the Threshold % you set in settings. For example, if you are using PA + Volume Delta mode and your threshold is set to 100%, the blended score must reach 100% of its maximum possible value. In addition to the score threshold, the candle must also meet other proprietary conditions that we have determined to be likely indicators of potential continuation in that direction.
Signals are designed to be meaningful rather than frequent, highlighting only the highest conviction candles.
The signal arrows and TradingView alerts have their own independent toggles, so you can use arrows only, alerts only, or both together. To receive push notifications, emails, or pop-ups, you still need to set up the alert through TradingView’s alert menu after enabling the alert toggle in the indicator settings.
Adjust the Threshold % to control sensitivity — higher values produce fewer but more selective signals. Start with the default of 100% and lower it if you want more signals.
Signal and Alert Settings:
- Show Signal Arrows — Toggle buy/sell arrows on the chart. Does not affect alerts.
- Enable Alerts — Toggle alert conditions. You still need to create the alert in TradingView’s alert menu. Does not affect signal arrows.
Threshold % — Minimum score required to trigger, as a percentage of the maximum possible score. Default is 100%. - Signal Buy/Sell Color — Customize the colors for buy and sell signal arrows.
March 19, 2026
Updated the request.footprint() call parameters to improve performance on tickers with large amounts of ticks per bar.