Order Block Indicator
For Tradingview
PREMIUM INDICATOR
The Order Block Indicator is a multi-timeframe institutional order detection tool designed to identify significant price levels where large order activity has occurred. Using a proprietary adaptive algorithm, the indicator analyzes order size and frequency from multiple timeframes to determine areas where price is likely to have a significant reaction when it returns to those levels.
The indicator adapts to price and volume data in real time, detecting only the levels with the highest importance and displaying them with rankings for ease of use. This adaptive approach means the indicator automatically adjusts to current market conditions, providing relevant levels during both high-volatility and low-volatility periods.
The indicator works on any market with volume data, including futures, stocks, forex, crypto, and commodities.
This indicator can be used on lower timeframe charts such as 1 minute intervals for day trading, as well as higher timeframe charts such as 1 day for swing trading. Below are some screenshots as examples.
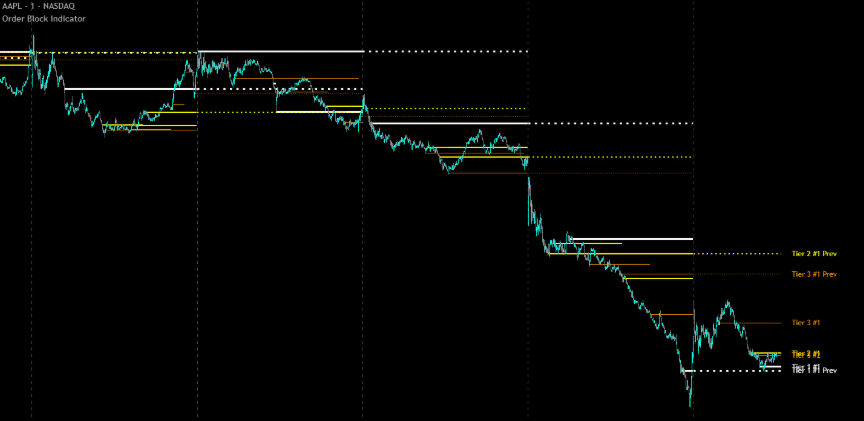
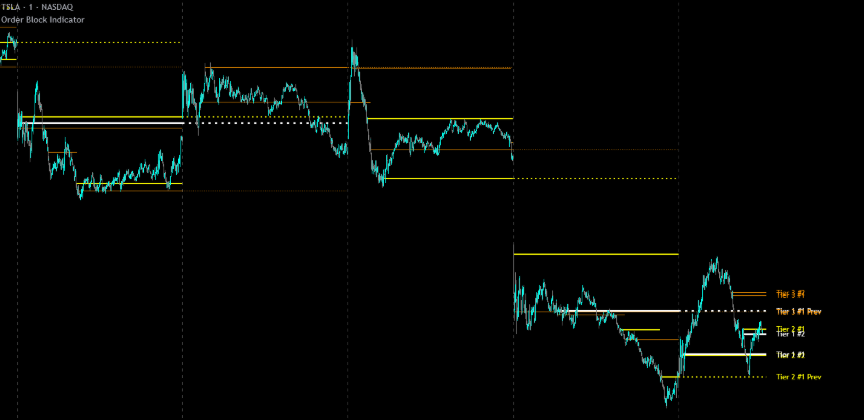
Day Trading 1 Minute Chart Examples
Apple on the 1 minute chart with default settings.
Tesla on the 1 minute chart with default settings.
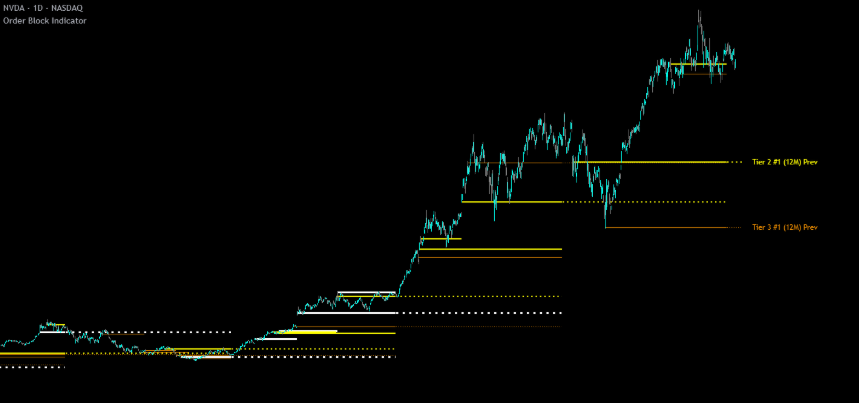
Swing Trading 1 Day Chart Examples
NVIDIA on the 1 day chart with 5m, 15m, 30m timeframes for data and 12 month session tracking.
Apple on the 1 day chart with 5m, 15m, 30m timeframes for data and 12 month session tracking.

Nasdaq Futures (NQ) on the 1 day chart with 5m, 15m, 30m timeframe for data and 12 month session tracking.

How It Works
The Order Block Indicator analyzes data from three separate lower timeframes (default: 10T, 1S, 5S) to identify areas of significant institutional order activity. The proprietary detection algorithm evaluates order size and frequency to find price levels that are most likely to act as future support or resistance.
Adaptive Detection
The indicator continuously adapts to market conditions in real time. Rather than using static thresholds that become irrelevant as volatility changes, the algorithm dynamically adjusts its sensitivity. This allows the indicator to identify meaningful institutional activity during both quiet overnight sessions and volatile market opens.
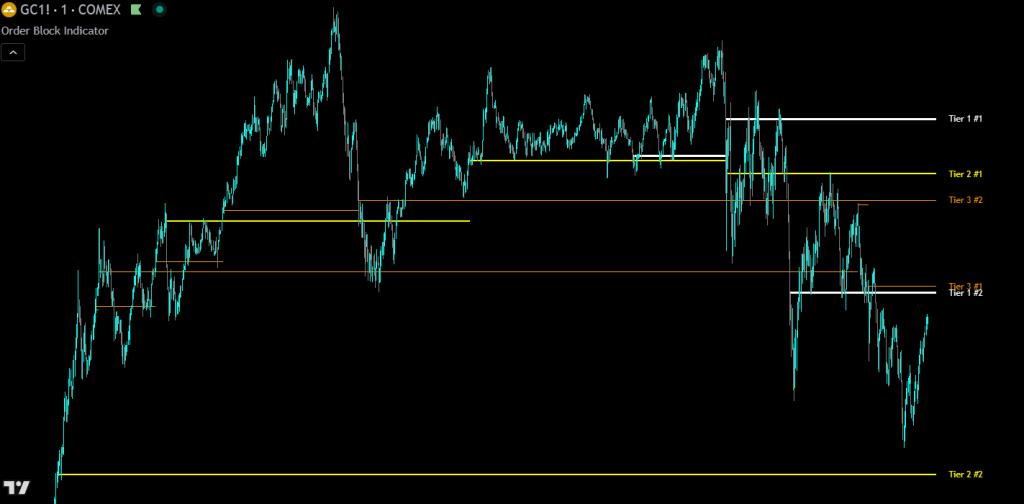
Three-Tier Classification
Detected order blocks are classified into three tiers based on their significance:
- Tier 1 (thickest lines): Highest importance — the strongest levels detected
- Tier 2 (medium lines): Second highest importance — significant levels
- Tier 3 (thinnest lines): Third highest importance — moderate levels
Tier 1 levels represent areas where price is most likely to react strongly. Tier 2 and Tier 3 levels represent slightly less significant areas but are still extremely valuable levels.
Ranking System
Within each tier, levels are ranked by their significance. The #1 ranked level in each tier represents the most important level for that classification. Rankings update in real time as new levels are detected, ensuring you always see the most relevant information.
Session-Based Tracking
Levels are tracked within user-defined sessions (Daily, Weekly, or Monthly). At session boundaries, current levels are terminated and the most important levels from each tier can optionally extend forward as “Prev” lines. This allows you to maintain awareness of key historical levels while focusing on current session activity.
How To Use This Indicator
Identifying Support and Resistance
Order block levels represent prices where significant institutional activity occurred. When price approaches these levels, watch for:
- Price reactions (bounces or rejections, especially with large wicks) confirming the level’s significance
- Breakouts and then retests of these levels
- Finding reversals when an order block appears at extreme ends of an upward or downward move and then price bounces off of that order block
- Add multiple instances of the indicator to your chart with different tracking sessions such as 1H, 1D and 1W to get very recent important levels, important levels from the day’s session and important levels from the week’s session. These can all provide excellent levels to enter trades and scalp bounces from
Using the Tier System
- Tier 1 levels represent the strongest institutional interest and often produce the most reliable reactions
- Tier 2 levels indicate significant activity and serve as high-probability support/resistance
- Tier 3 levels show moderate activity and can be used for scalping targets or secondary reference points
- When multiple tier levels cluster near each other, the zone gains exceptional significance
Trading Approaches
- Use Tier 1 and Tier 2 levels for primary trade decisions (entries, exits, stop placement)
- Use Tier 3 levels for scaling in/out or as warning zones
- Scalp rejections at the order blocks, especially when large wicks form at the level
- Watch for price reactions at “Prev” levels from the previous session
- Combine with price action confirmation (candlestick patterns, market structure, order flow) for best results
- Many times price will push through an order block and appear to not respect that level, but then when price comes back to it, the candle bodies and wicks show clear significance to that level. Use this to your advantage a trade the retests of these levels.
Understanding Rankings
- #1 = Most significant level in that tier this session
- #2 = Second most significant, etc.
Settings Guide
Global Settings
- Session Length To Reset Tracking: Determines how often level tracking resets (Daily, Weekly, Monthly). Day traders typically use Daily; swing traders may prefer Weekly or Monthly.
- Show Tracking Session Period On Labels: When enabled, appends the session timeframe to labels (e.g., “Tier 1 #1 (D)”). Useful when running multiple instances with different session settings.
- Lower Timeframe #1, #2, #3 For Data: The three data resolutions used to scan for orders (default: 10T, 1S, 5S). All three must be smaller than your chart timeframe and should be different from each other. Choose the lowest timeframes you can that still provide at least 2 full session periods of historical data.
Tier 1 Settings (Highest Importance)
- Tier 1 Levels On/Off: Enable or disable Tier 1 level display
- Labels On/Off: Show or hide Tier 1 labels
- Number Of Tier 1 Levels To Track: How many Tier 1 levels to display, ranked by significance (default: 2)
- Extend Previous Session Important Levels On/Off: When enabled, top levels extend into the next session as “Prev” lines
- Number Of Previous Session Levels To Extend: How many of the top Tier 1 levels to carry forward (default: 1)
- Line Color: Color for Tier 1 lines and labels (default: White)
Tier 2 Settings (Second Highest Importance)
- Same structure as Tier 1
- Default color: Yellow
Tier 3 Settings (Third Highest Importance)
- Same structure as Tier 1
- Default color: Orange
Style Settings
- Previous Session Line Style: Choose Solid, Dashed, or Dotted for extended “Prev” lines. Dotted (default) helps distinguish historical levels from the current session levels.
- Label Offset: Distance from current price to place labels. Also controls how far lines extend to the right. Increase if labels overlap price action.
- Text Size: Font size for all labels (1-20 range).
Recommended Configurations
Day Trading (Intraday)
- Session: Daily (D)
- Timeframes: 10T, 1S, 5S (default settings)
- Levels per tier: 2
- Extend previous: 1 per tier
- Best for: Scalping and intraday swing trades on futures and active stocks
Swing Trading
- Session: Weekly (W) or Monthly (M)
- Timeframes: 5S, 10S, 15S or 1, 5, 15 (minutes)
- Levels per tier: 2
- Extend previous: 1 per tier
- Best for: Multi-day positions on any market
Highest Confidence Only (Minimal Display)
- Turn OFF Tier 2 and Tier 3 levels
- Track only 1-3 Tier 1 levels
- Result: Only the most significant levels are displayed
- Best for: Clean charts focused on the highest-probability levels
Multi-Session Analysis
- Add the indicator three times to the same chart
- Instance 1: Session = Hourly, enable “Show Session Period On Labels” and set timeframes 10 1T, 10T, 1S
- Instance 2: Session = Daily, enable “Show Session Period On Labels” and set timeframes to 10T, 1S, 5S
- Instance 3: Session = Weekly, enable “Show Session Period On Labels” and set timeframes to 5S, 10S, 15S
- Use different colors for each instance
- Result: See hourly, daily and weekly significant levels with clear distinction
Data Requirements And Limitations
Subscription Tier Considerations – The default settings use tick-based intervals (10T) and second-based intervals (1S, 5S), which require a paid TradingView subscription.
If You Don’t Have Tick/Second Data – Access Simply change the “Lower Timeframe For Data” settings to minute-based intervals. For best results, use the lowest timeframes you can that still give you at least 2 previous tracking sessions worth of data. For example if you only have minute intervals available, use 1m, 2m & 3m as long as you have enough data to view the previous 2 days worth of historical bars when set to a 1 day tracking session.
The indicator works effectively with minute-based data for swing trading on higher timeframe charts.
Additional Notes
- All three lower timeframes must be smaller than your chart timeframe
- Choose timeframes that provide at least 2 session periods of historical data for best results
- Levels are confirmed at bar close to ensure accuracy, so you will not see levels until the current bar is confirmed
- Works on any market with volume data (futures, stocks, forex, crypto, commodities)
Understanding The Visual Elements
Line Widths
- Tier 1: Thick (3px) — Highest importance
- Tier 2: Medium (2px) — Second highest importance
- Tier 3: Thin (1px) — Third highest importance
Label Format
- Current session: Tier {#} #{Rank} (e.g., “Tier 1 #1”)
- Previous session: Tier {#} #{Rank} Prev (e.g., “Tier 1 #1 Prev”)
- With session suffix: Tier {#} #{Rank} ({Session}) (e.g., “Tier 1 #1 (D)”)
Line Styles
- Current session levels: Solid lines
- Previous session levels: User-selected style (Solid, Dashed, or Dotted)
Default Colors
- Tier 1: White — Most important levels stand out clearly
- Tier 2: Yellow — High visibility for significant levels
- Tier 3: Orange — Warm color for moderate-importance levels
Tips For Best Results
- Start with defaults: The default 10T/1S/5S configuration is optimized for intraday trading. Adjust only after understanding how the indicator behaves on your preferred market and based on your data allowances from your subscription tier.
- Prioritize Tier 1 levels: These represent the strongest detected activity and typically produce the most reliable price reactions.
- Watch for level clusters: When levels from multiple tiers appear near each other, that price zone has exceptional significance.
- Use Previous Session levels: “Prev” levels often act as significant support/resistance in the new session, especially Tier 1 Prev levels.
- Combine with price action: Order block levels work best when combined with candlestick patterns, market structure analysis, or other confirmation techniques. One of the best ways to trade these levels is to look for large wicks at these levels as confirmation that price is going to react there and then scalp those rejections.
- Adjust for your trading style: Day traders should use Daily sessions with tick/second timeframes. Swing traders should use Weekly/Monthly sessions with second/minute timeframes.
Troubleshooting
Indicator Not Loading or Displaying Incorrectly
Toggle the “Fix Indicator Loading Error” checkbox ON or OFF to force TradingView to restart the indicator.
No Levels Appearing
- Verify your subscription tier supports the selected lower timeframe intervals
- Check that at least one tier is enabled with “Number of Levels” greater than 0
- Confirm that your lower timeframes are smaller than your chart timeframe
- Ensure you have enough historical data available on your chart
- If using 1T for data on charts with lots of participants such as NQ, you might not get much data during regular trading hours due to there being tons of transactions happening every second which limits how far back the indicator can gather data from
- There may not be any levels that were detected as having major significance within the tracking period and with enough lower timeframe data provided
Too Many or Too Few Levels
- Adjust “Number of Levels To Track” for each tier
- Disable lower-importance tiers (Tier 2, Tier 3) for a cleaner display
- Enable more tiers if you want additional reference levels
Labels Overlapping Price Action
- Increase “Label Offset (Bars)” in Style Settings
- Reduce text size if needed
This indicator is designed to assist with identifying potential support and resistance zones based on detected institutional order flow activity. As with any technical analysis tool, it should be used as part of a comprehensive trading approach that includes proper risk management. Past performance of identified levels does not guarantee future price reactions.
Release Notes
11/25/2026
Updated default settings to show only the most important levels.
Added a new feature that allows you to turn on and see exactly when the data from each lower timeframe started so you can optimize your lower timeframe settings to have enough data for optimal indicator performance.
This feature is called Show Lower Timeframe History On Chart and when toggled on(off by default) and it will show circles at the bottom of the chart while data is available for that timeframe and a label on the first bar of data letting you know what timeframe’s data started there. The colors of the circles and labels and label text are adjustable in the bottom style settings group.

The circles will overlap each other until one timeframe runs out of data, but since your timeframes should be in ascending order(1S, 5S, 10S) then the shorter timeframe will end the circles sooner and then you will see timeframe 2 circles and when that data runs out you will see the circles for timeframe 3. This helps you visualize exactly how much data you get with those specific settings so you can adjust your settings to provide the type of data you prefer.
You want to make sure that the lower timeframes you are using provides data for the entire tracking session you have set with all 3 lower timeframes and potentially multiple tracking session periods for backtesting purposes. For example, if you have the tracking session set to 1 day, then make sure you get data from all 3 of your lower timeframes all the way back to before the start of the most recent day.
So if it is Wednesday at market open, your indicator should show the lower timeframe #1 colored circles all the way back to market open on Tuesday or further. This means that all 3 lower timeframes were providing data to the indicator during the entire tracking session so you will get more reliable results.
Note that when viewing the data start point on continuous futures contracts charts like NQ1! and ES1! the data will start at 1 week prior to your current time due to continuous contracts and how Tradingview allows data to be handled with these types of markets where contracts roll over.