What Is A Liquidity Grab/Sweep? Examples & How To Trade Them

What A Liquidity Grab/Sweep Means
Liquidity sweeps, also commonly called liquidity grabs are when institutional traders push price just beyond a recent pivot high or pivot low, which then triggers the stop losses of many retail traders and many times causes the price to quickly reverse.
Since many day traders use pivot points also known as market structure as their stop loss and take profit levels, the large buyers and sellers know that they can fill their large orders without much slippage by pushing price just beyond those pivot points. This is why the price will usually reverse quickly after a liquidity grab.
Liquidity grabs and liquidity sweeps are terms and trading methodologies used by traders that follow smart money concepts principles, made popular by ICT also known as the Inner Circle Trader.
Check out other popular day trading strategies if you want to learn about different ways to trade.
Difference between Liquidity Sweeps And Liquidity Grabs
A liquidity sweep is very similar to a liquidity grab, the difference being a sweep happens with multiple candles going beyond the pivot. It could be a few candles or a string of candles that stay just beyond that key price level to gather orders before turning around. Sweeps also typically take out multiple swing highs or lows near the same level as it progresses.
A liquidity grab will move just beyond the key level pivot and then reverse quickly with a sharp move. They are both very similar, but a sweep looks to get more orders, whereas a grab is much faster and typically means the institutional traders orders have been filled enough to allow price to move in the other direction with momentum.
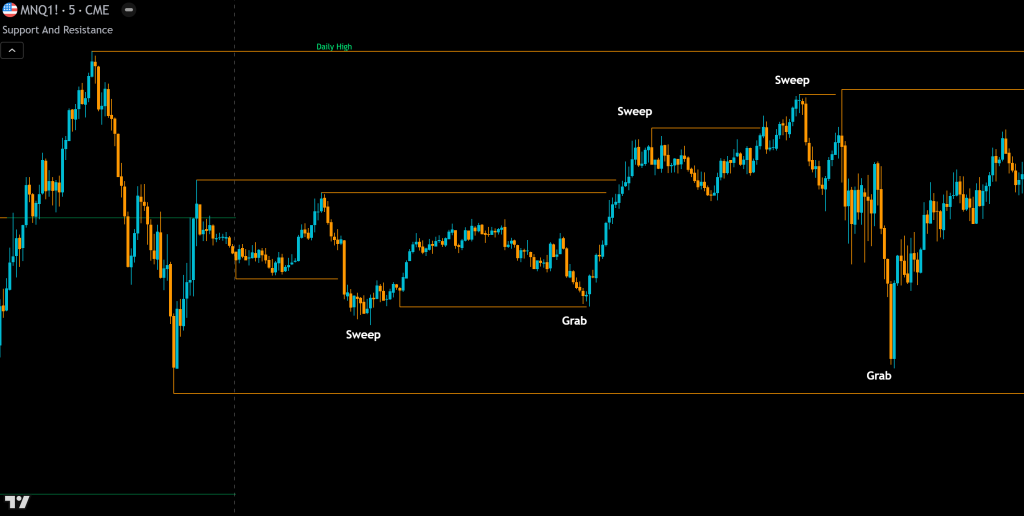
Examples Of Liquidity Grabs
Some examples of liquidity grabs are shown below, but here are some of the main details that classify these types of price movements.
- Price will leave behind a major swing high or low and then reverse with a sharp price movement. This usually happens when price hits a key level such as the previous day or week high or low.
- Then the price will return close to that major pivot high or low and bounce. This may happen a few times, leaving multiple minor pivot highs or lows behind which is where traders will put their stop losses.
- The liquidity sweep will then push prices just beyond those minor pivot highs or lows and trigger the stop losses while also filling the orders of the institutional buyers and sellers.
- Then price will usually make a fast and sharp move away from the key levels where they just swept the liquidity and will seek an opposite pivot high or low to then take more liquidity from retail traders.
Below are a few examples of liquidity sweeps on the charts.
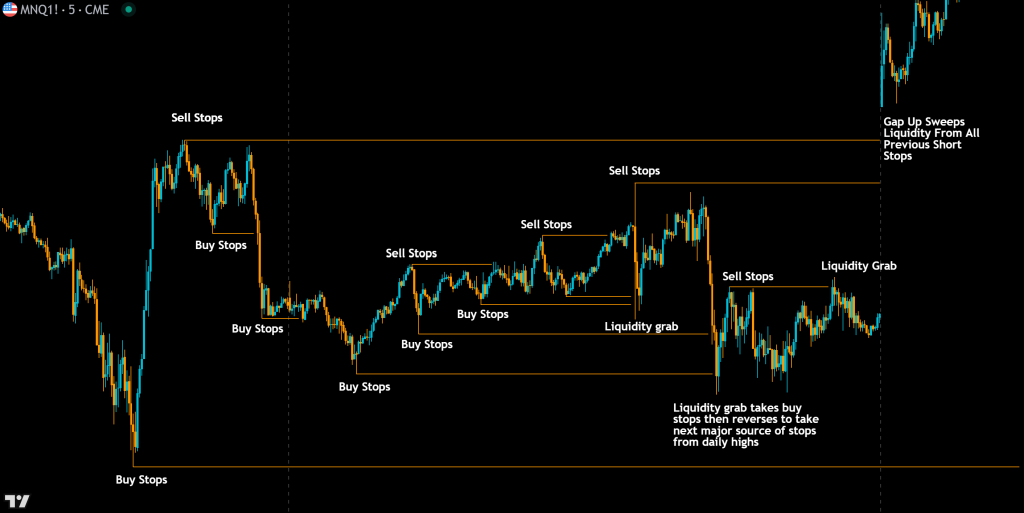
How To Identify A Liquidity Sweep And Grab

You can find liquidity grabs by looking for a major swing high or low and then identifying minor swing highs or lows that are near the major pivot high or low. The minor pivots will have a bunch of stop losses just beyond those pivots and institutional buyers will look to push price just beyond those minor pivots, but not beyond the major pivot unless they want to push price beyond that in a continuation.
This also happens on smaller time frames when markets are trending. Since many retail traders move their stop losses just beyond the most minor pivot, institutional traders will fill their orders by pushing price just past those minor pivot levels to trigger those stop losses and then allow price to continue in the direction of the overall trend.
How To Trade Liquidity Grabs
Liquidity grabs are one of my favorite ways to trade any type of market because they allow you to get an excellent entry point and keep a tight stop loss. Here’s how to trade two types of liquidity sweeps:
Reversal Liquidity Grabs
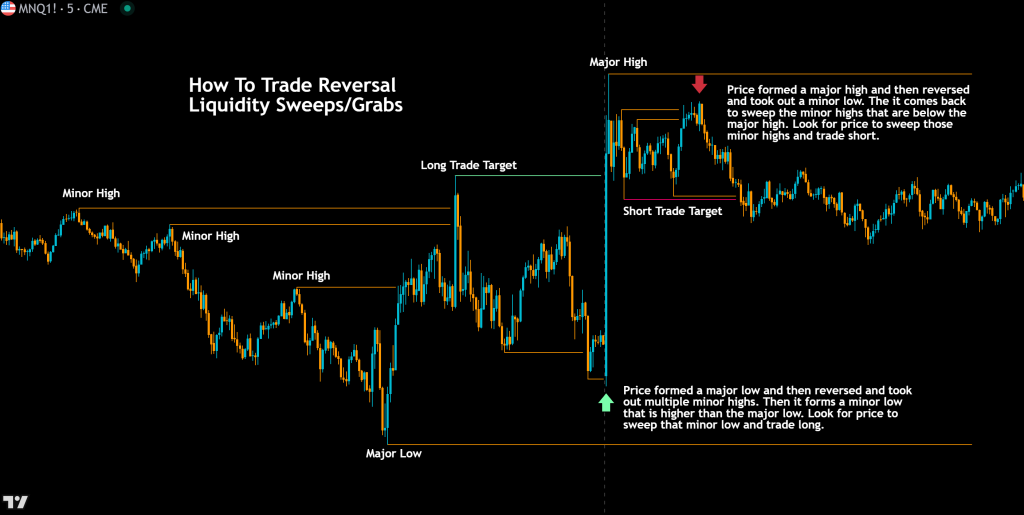
- Find the major pivot high or low. This will be a large move up or down that then reverses and starts to create a range inside of that large move.
- Wait for price to create a minor pivot that is near the extreme of the major pivot. Price will then move back away from the major pivot and leave behind that minor pivot where retail traders will put their stop losses.
- Then place a limit order for a trade going away from the major pivot that is at the tip of the minor pivot that was just created. Wait for a price move that goes to that level and sweeps liquidity. Place your stop loss just beyond the major pivot.
- Target the next minor pivot in the direction of your trade as your take profit level since price will likely move to sweep that liquidity next. Trail your stop loss along the way as price makes new minor pivots in the direction of the trade.
Trending Liquidity Grabs
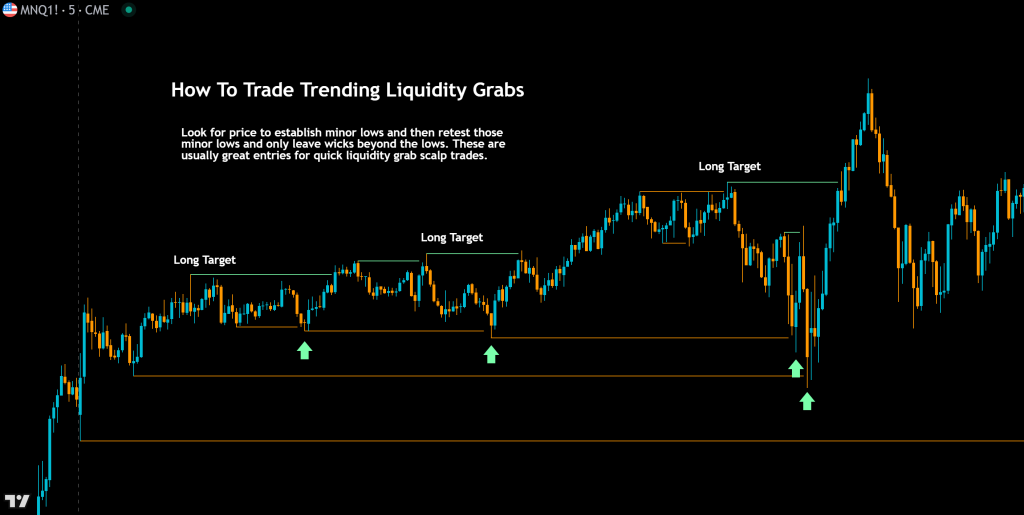
- Wait for the market to establish a trend up or down before you start trading with the trend.
- Once price makes a major pivot and then a minor pivot in the direction of the trend, place your order just beyond that minor pivot. Put your stop loss just beyond the major pivot. Target the next minor pivot that is in the opposite direction of the trend.
- Wait for price to come back and sweep the liquidity that lies beyond the minor pivot which is where your order will be.
- Then as the trend continues and starts to make new minor pivots along the way, you can move your stop loss to just beyond those until your stop loss is hit or your take profit level is hit.
You can practice trading these liquidity grabs and sweeps by using a paper trading account so that you won’t lose any real money while you get familiar with spotting and trading these types of day trading setups.
Figuring Out If Price Will Continue Or Reverse
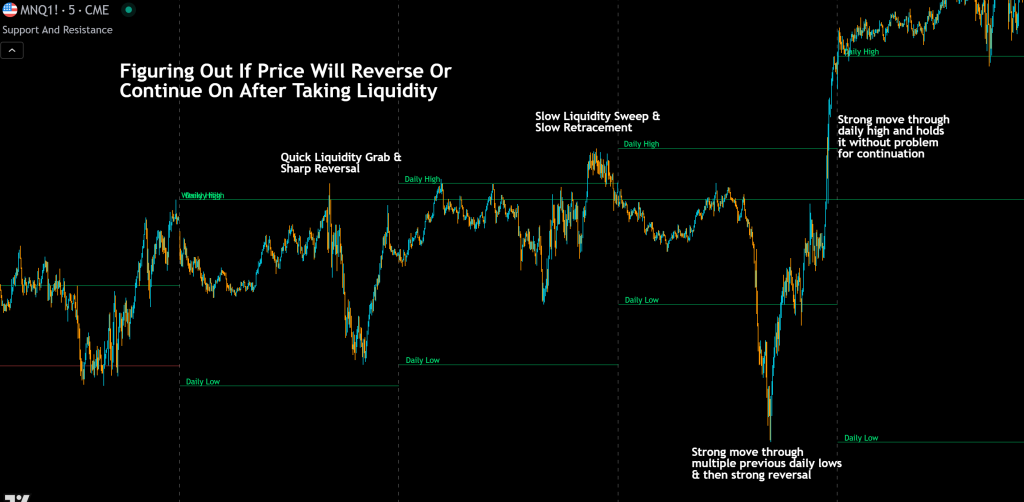
Once price takes the liquidity from a major pivot, you need to figure out if price is going to continue past that level or if it is going to reverse. Many times when price wants to make a big continuation move, price will sweep that liquidity from the major pivot and then hold just beyond it, possibly retest that level quickly and then continue.
When there is a lot of resistance at that level but it wants to continue beyond, it will usually go just past the major pivot, retrace about 25-50% of the move that swept the liquidity, consolidate and then start the continuation.
When price just taps the major pivot level and the candles do not close beyond that level, this usually means that price will reverse.
Useful Tools To Help Find Liquidity Grab Levels
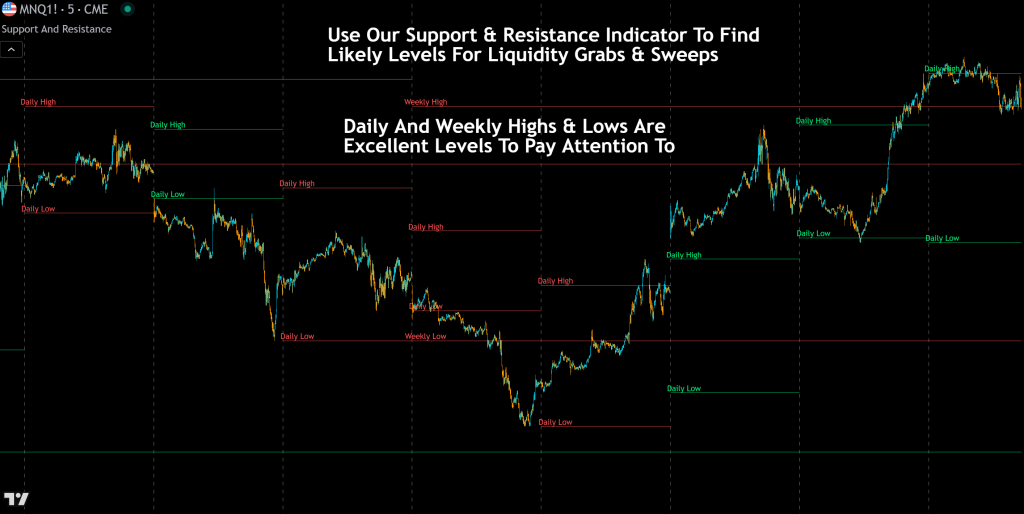
Finding levels where liquidity grabs and liquidity sweeps will happen can be done pretty easily when you have the right tools. Some of the best and most useful levels that price will have a liquidity grab at are previous day and week highs and lows. Price likes to run just beyond these levels and then turn around.
Some great indicators you can use to spot these levels easily are our higher timeframe candle levels indicator and our supply and demand trading indicator. Both of these tools will show you highs and lows of previous 1 hour, 4 hour, 1 day, 1 week, 1 month, 3 month and 1 year levels which are all extremely useful for this type of trading.