The best moving average for day trading is the SMA which is short for simple moving average. The simple moving average is the best because it is the most reliable and accurate for finding the actual average price, finding established trends, knowing where price should react and showing you areas where price needs to take control of in order for a reversal to happen.
LD By Lane Dotson · Last updated
The second part of the calculation for each moving average is the length which means the number of previous candles that will be used to calculate the moving average from. Some of the most popular lengths are 5, 8, 13 and 20 for short term moving averages which are typically used by scalp traders.
Longer term moving average traders typically use lengths such as 50, 100, 200 and 500. The lengths you use are up to you and what you prefer based on your style of trading.
Using the length of your choice and the source you have set, the calculation for a simple moving average is as follows:
SMA = (sum of the source value for a number of bars) / number of bars
So for example if you are using the close price as your source and a 20 period length, then you will take the last 20 bars closing price and add them together. Then you will divide the sum of those values by the period of time (length).
That is the basic formula for a simple moving average, but other moving averages are calculated based on the same principle, but with a small change depending on the type of moving average.

The best part about simple moving averages is that they are reliable and accurate which is the most important part of trading. Accuracy is key when trading because it helps you enter and exit trades at the most reliable points which helps reduce drawdown and maximize your wins.
Simple moving averages are a little slower to react than EMAs or HMAs because of how they are calculated.
Exponential moving averages are weighted more heavily with the most recent bars, so they will react faster than SMAs and some other moving averages. The quick reaction can help get you into and out of positions earlier which is why they are such a popular choice for day traders, scalpers and swing traders.
The quick reaction provided by EMAs comes with the downfall of not being as reliable as an SMA. Reliability is more important than quick reaction because entering trades too early can mean taking more losses.
Hull moving averages have some of the fastest reaction times because it uses a custom formula that is based on a weighted moving average formula. This moving average will be even more responsive than the EMA and helps to catch the earliest entries and exits.
Due to how responsive the HMA is, it will give more false readings than other moving averages.
Volume weighted moving averages are excellent for trading because they take volume into account. Volume plays a major role in how and when price will react, so the VWMA can help improve the reliability of moving averages.
Due to volume being such a big factor in the calculation of this moving average, it can be very slow to react and will not provide early entries or exits from positions.
Weighted moving averages will weigh the most recent bars heavier to help it react more quickly, which can be very useful in helping traders get into and out of positions at ideal times.
The downside to this moving average is that its responsiveness provides more false readings and it also does not react as quickly as an exponential moving average.
Relative moving averages are much smoother than normal moving averages, which makes them easier to read on your charts and usually more reliable for finding good entry points.
The smoothness of these RMAs can also mean that they react slowly and will not give you very early entries or exits which can increase the risk for your trades.
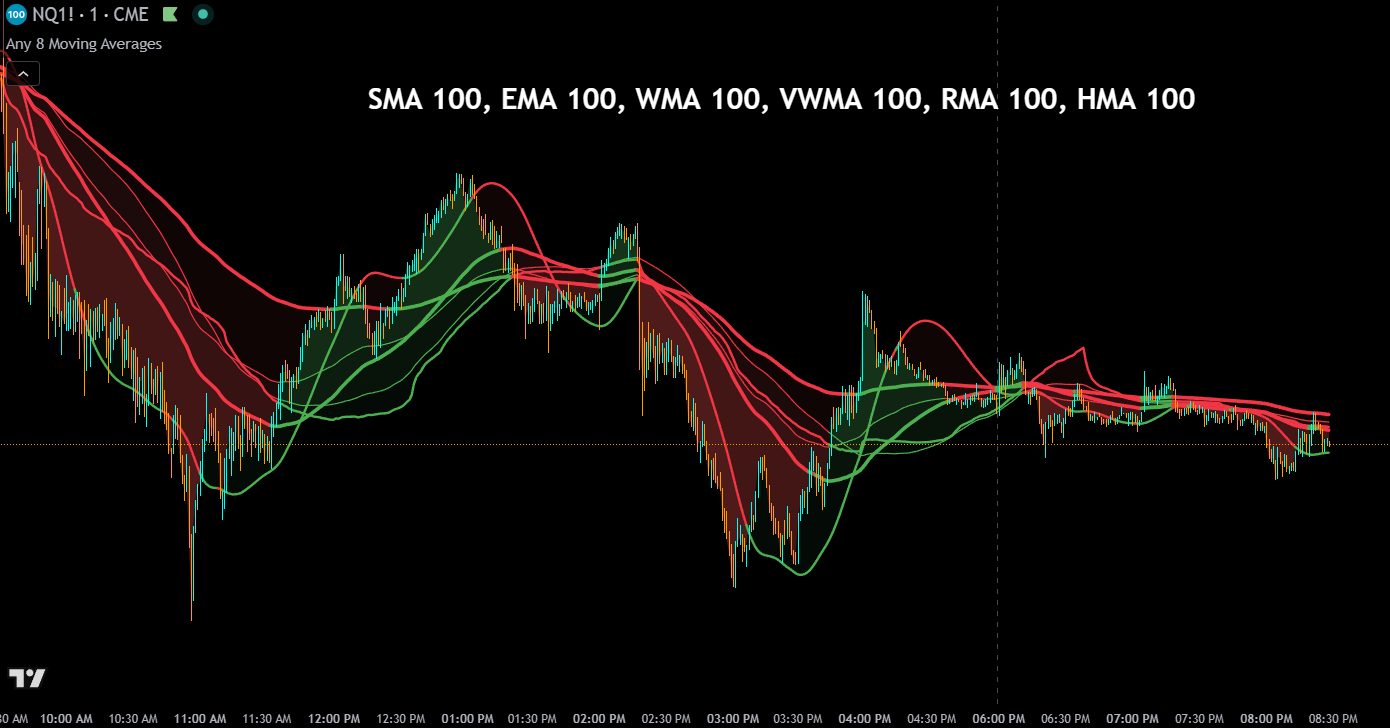
It combines the SMA, EMA, WMA, VWMA, HMA and RMA together to give you one smoothed out moving average that still reacts quickly, but is also reliable. It has become a very popular indicator on TradingView for those reasons.
There are a few different ways that you can use moving averages to help you trade.
For scalping on the 1 to 5 minute charts, shorter lengths like the 8, 13 and 20 SMA work well because they react quickly to price changes. Many scalpers also combine a short length (like the 8 or 13) with a longer length (like the 50 or 100) to confirm trend direction before taking entries on pullbacks to the shorter moving average.
SMA is generally more reliable because it gives equal weight to all bars in the calculation, making it a better representation of the true average price. EMA reacts faster because it weights recent bars more heavily, but that speed also produces more false signals. If you value accuracy and reliability over speed, use SMA. If you need faster entries on very short timeframes, EMA can work but expect more whipsaws.
Yes, and this is a very common approach. Many traders use two or three moving averages of different lengths on the same chart, such as the 50, 100 and 200 SMA. When the shorter moving average crosses above the longer one, it signals a potential uptrend. When it crosses below, it signals a potential downtrend. You can also use our free Combined Moving Averages indicator on TradingView which merges six different moving average types into one line.
BETTER TOOLS, BETTER TRADES
Explore our day trading indicators built specifically for intraday trades.