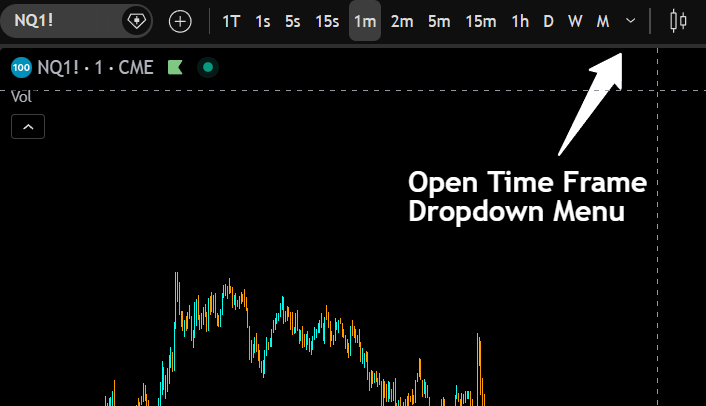
TradingView lets you switch chart timeframes by clicking any interval in the top-left toolbar or opening the dropdown menu for the full list. Adding your most-used timeframes as favorites keeps them one click away at all times. This guide also covers custom intervals and range charts for traders who want to go beyond standard time-based bars.
LD By Lane Dotson · Last updated

To make your life easier while trading, I recommend adding your most used time frames to your favorites so that they show on the top row of your chart settings at all times. This makes it easy to just click the timeframe you want to switch to, without having to open up the dropdown menu and search for the specific time frame you want.
To add time frames to your favorites, open up the time frame menu and then click the star icon next to any of the time frames you like to use regularly. Clicking the star icon adds that time frame to your favorites and whatever time frames are in your favorites will then appear in the top row of your chart settings.
Now you have a full list of your favorite time frames so you can easily switch back and forth.
TradingView allows you to create and use custom time frames outside of the normal time frames. This can be done easily by clicking the option at the top of the time frame dropdown titled + Add Custom Interval.
When you click the add custom interval option, it will open a popup window with 2 options: Type and Interval. The type option lets you select from a list of time frame types which are minutes, hours, days, weeks, months and range. Choose your type and then move to the next option, interval. In the interval box, you manually input the exact number of time units you want to use according to the type option you already selected. Then just click add and it will add that option to the appropriate time frame type section of your menu.
Let’s look at some examples of how to set up custom time frames.
Then once you have created your custom intervals, make sure to find them in the dropdown time frame menu and click the star icon next to them so they appear in the top row of your chart for easy access at all times.
To delete a custom time frame, just click the trash can icon next to that time frame in the dropdown menu.
Tip: Make sure you set your chart time zone to the same as the exchange time zone so that your times on the chart reflect the same times as the exchange. We have a complete guide on how to change the time zone on TradingView charts you can read to learn about the process and understand what time zones to use.
It is important to note that when you are creating custom time frames, you will notice that there is no option in the type menu for tick or second intervals. This means that TradingView does not allow you to create custom time frames using ticks or seconds, so stick to minute intervals and above.
If you are looking to remove time from the equation when charting, try out range charts. Range charts are a unique way to look at price, without normal time chunks breaking up each bar. Instead, each bar shows the range of price when it has moved X number of ticks up or down from the opening price of that bar.
I know that sounds confusing, but here is an easy breakdown.
If a bar opens at $1 and the minimum tick for that asset is $.01 then $.01 is 1 range. So if you are set to a 50 range chart, then $.50 is the range needed to travel as a total from up and down movement from the open price for a bar to print and finalize. The total range is calculated by multiplying the range amount 50 by the minimum tick $.01. So 50 X $.01 would mean each bar will represent $.50 of movement away from the opening price. That movement will be the combined up movement and down movement.
Here is another example. On a chart with a $.25 minimum tick and a 100 range chart, let’s say the bar opens at $500. 100 ticks at $.25 per tick means one bar would represent 100 x $.25 = $25 per bar. So if the bar opens at $500 and moves up by $14, then moves down by $11, the combined total of $14 and $11 is $25 which completes the range for that bar and the bar will then immediately close upon reaching a total of $25 in movement.
Most day traders use time frames between 1 minute and 15 minutes for entries and exits. Many also keep a higher time frame like the 1 hour or daily chart open alongside their lower time frame to understand the broader trend before placing trades.
Yes. TradingView's multi-chart layout feature lets you display multiple time frames side by side on the same screen. The number of charts you can view simultaneously depends on your TradingView plan. Free accounts get one chart, while paid plans allow up to 8 or more.
No. Custom time frames do not count toward your indicator limit. They are simply alternative intervals for displaying candle data and do not use any additional resources on your chart.
LEVEL UP YOUR CHARTS
Explore our Premium Indicator Suite. 10 custom indicators built for day traders and swing traders.
Don't have TradingView yet? Get started with TradingView →
Links on this page may be affiliate links.